
Excel Tool Design
To many of our clients, Data Analysis Australia is well known for our ability to use complicated and sophisticated statistical and mathematical methods to analyse and understand our clients' data. Importantly, a key characteristic of Data Analysis Australia is our ability to translate our findings into a form that is designed specifically for our clients' needs. This could be anything from a highly technical report to a report written in everyday language, avoiding statistical jargon, but always explaining the relevant outcomes in context of our clients' business.
However, cases arise where we consider presenting results in a written report alone is not sufficient for our clients' needs. In particular, clients will often wish to work interactively with the results from our analysis. For example, they may wish to apply predictive models to future cases, or to select various subsets of the data to analyse, or to examine the effects on resource forecasting of changing various factor levels. Developing a front end to often sophisticated simulation and modelling systems is one way to allow the client to achieve this. To this end, Data Analysis Australia is increasingly finding the use of custom-designed tools, developed in various software packages such as R or Excel, to be an effective means of communicating and translating analysis results. These are designed to be readily understood and interactively used by both the client and their target audience.
The custom-designed Excel tool forms part of our complete solution and is used by clients in diverse industries, including government, health, power, utilities and transport. The range of current and potential applications is also extensive. To date, Data Analysis Australia has designed Excel tools for purposes that include:
- improving data quality;
- simplifying and fool-proofing the application of forecasting models;
- speeding-up data entry and analysis;
- interactively examining potential forecasting scenarios; and
- breaking down and presenting a large amount of information in easily digestible "chunks".
Some examples of Excel tools created by Data Analysis Australia are given below.
User-Friendly Simulation Modelling Tools
Data Analysis Australia developed simulation models that allowed the modelling of complex queuing systems by building in the known variation in arrival times, the time spent in the queue and complex prioritisation rules. As the users of the model would not be familiar with the simulation software required to run the scenarios, Data Analysis Australia took care to ensure that the statistical complexities and the "nuts and bolts" of the models were hidden from the user. This was partly achieved by incorporating a user-interface built in Excel that was embedded into the model. The user-interface provided the user with an overview of the purpose of the model, model assumptions, the various input and output sheets and instructions for running the model. The simulation model automatically read in the information entered into the user-interface, meaning that the user had minimal interaction with the specialist simulation software. The models were successfully installed onto the client's computer network and have provided the client with the ability to quickly determine the feasibility of taking on new customers given current customer levels.
Improving Data and Analysis Quality and Speed
Data quality is a critical issue when it comes to statistical analysis. Early in 2011 this became an area of particular concern for one of our clients. Laboratory technicians would routinely enter test results directly into an Excel spreadsheet, but large numbers of data entry errors and inconsistencies slowed the analysis process and resulted in unreliable output. Data Analysis Australia was able to assist by designing and producing an Excel tool with a front-end data entry form, automated analysis and automated plots of desired outputs. Quality control within the data entry was achieved by incorporating data validation rules and drop-down lists, which virtually eliminated data entry errors, while substantially speeding up the data entry process. In addition, the tool design enabled the client to analyse either the entire data set, or any subset of the data, by simply clicking a few buttons. Once the relevant inputs were selected, the tool automatically performed the required analysis and produced appropriate plots. The resulting Excel tool was so successful that the client has since commissioned a similar tool for another area of their business.
Effective Presentation of a Large Amount of Information
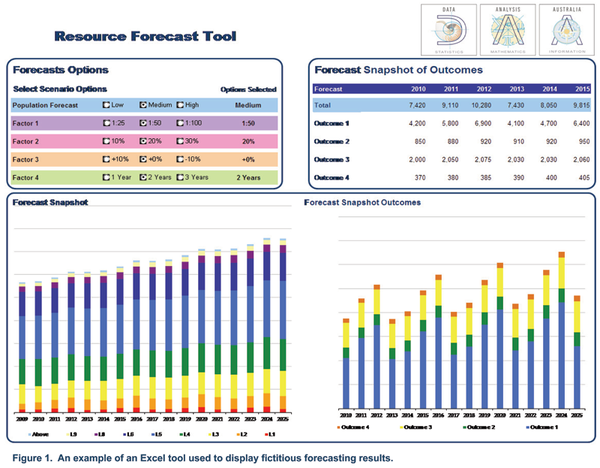
In 2010, Data Analysis Australia assisted a government agency with the formulation of planning policies by developing 30-year forecasts of their resourcing requirements.
A key design requirement was the ability to examine the effect on workforce forecasts of varying levels of several factors, such as attrition rates. Data Analysis Australia was able to achieve the desired versatility, using a sophisticated modelling process. Of necessity, however, this resulted in a suite of nearly 250 potential forecasts - a formidable amount of data to present in a meaningful and accessible way. The approach taken by Data Analysis Australia's project team was to design a front end Excel tool (refer to Figure 1), that allowed factor levels to be changed at the click of a button. The Excel tool then automatically displayed results that related to the particular combination of factor levels selected and provided plots of these forecasts that automatically changed as factor levels were changed.
While the analysis techniques that generated these forecasts required a high level of statistical expertise, the front end Excel tool provided the client with a way to examine the pertinent results in a concise and easily understood manner.
Application of a Forecasting Model
In 2011, Uropath-Tissugen Prostate Cancer Research Centre contracted Data Analysis Australia to produce model diagnostics and plots suitable for inclusion in an article they were submitting for publication in the Journal of Urology. The client had developed a logistic regression model to predict the probability that a prostate cancer patient has Minimal Cancer. In order to facilitate the clinical use of this model, Data Analysis Australia designed an Excel tool that allows probabilities to be calculated for future patients, based upon the fitted model. The clinician is asked to input relevant data, such as age, for an individual patient and the tool automatically calculates that patients' model-based predicted probability of Minimal Cancer, as well a 95% confidence interval on the prediction.
While the model development required the use of specialist statistical software and an understanding of statistical techniques, the use of a front end Excel tool allowed the model to be implemented in a clinical setting using readily available software and without the need for statistical expertise. The client considers this tool to be a "most valuable asset".
Data Analysis Australia has both the statistical expertise and the practical experience, as demonstrated in the above examples, to design front end tools in Excel for a variety of applications. This is only a small example of the way Data Analysis Australia can provide uniquely designed software tools to meet our clients' statistical and output requirements.
September 2011