
Financial Literacy in Australia - Segmentation Analysis
Overview
This case study discusses a collaborative project undertaken by The Social Research Centre and Data Analysis Australia for the Department of Families, Housing, Community Services and Indigenous Affairs [In 2013 most functions were assumed by the Department of Social Services]. The Social Research Centre conducted the 2008 ANZ Survey of Adult Financial Literacy in Australia and this project involved analysing that data. Data Analysis Australia conducted a segmentation analysis and The Social Research Centre undertook detailed profiling and reporting of the segments. Here we focus on the segmentation analysis stage of the project.
The Problem:
How to create a robust and meaningful segmentation of the population on the basis of personal money management attitudes and behaviour.
The Data Analysis Australia Approach:
- To combine Principal Component Analysis with statistical clustering techniques to identify the key attitudes and behaviours that differentiate between segments and, just as importantly, those attitudes and behaviours that do not assist in differentiating.
The Result:
- The identification of five key segments within the population and detailed profiles of each segment that will allow policy makers to understand how money is managed within the community, which will in turn inform the development of new approaches to assist people in financial difficulty.
The Problem
The Department of Families, Housing, Community Services and Indigenous Affairs (FaHCSIA) aims to improve the lives of Australians by creating opportunities for economic and social participation by individuals, families and communities. To assist families and individuals with their personal money management, the Department recognised that they needed to better understand people's financial behaviour and identify potential obstacles to changing behaviour.
The results of the 2008 ANZ Survey of Adult Financial Literacy in Australia were available, but included almost 800 variables containing responses to a 140 page questionnaire. How could meaningful information be extracted from so many variables?
The Data Analysis Australia Approach
In the marketing world, segmentation analysis is often undertaken to highlight where marketing efforts may be focussed, for example by identifying those who are most likely to buy a product. A segmentation approach was taken here to identify groups of people who were more likely to need assistance with money management issues, as well as other groups who were already coping well. After defining the segments, detailed profiles of each segment were created (undertaken by The Social Research Centre) to provide FaHCSIA with the information needed to develop individualised strategies to best assist each segment.
Segmentation analysis is not a statistical technique in itself, but more an art that combines several statistical techniques. This combination may include some or all of the following:
- Principal component analysis (PCA);
- Factor analysis;
- Cluster analysis;
- Classification and regression trees (CART);
- Discriminant analysis;
- Correspondence analysis;
- Random forests; and
- many others.
While some people may believe it is possible to standardise segmentation analysis by choosing a single technique, such as CART, and always applying this technique, Data Analysis Australia's experience has been that there is no one-size-fits-all approach to segmentation. Every dataset is different and an approach that works for one dataset may give meaningless results for another. Therefore, one of the most important stages of the analysis is exploration of the data.
Data Analysis Australia explored a number of approaches, using various combinations of PCA and cluster analysis, to determine the most appropriate approach for this particular dataset. A key consideration was the robustness of the analysis - relatively minor changes in the input variables should not significantly change the final outcomes. Another consideration was the size of the resulting segments. One approach that was explored (and discarded) suggested that respondents should be separated into six segments. However approximately 90% of respondents were grouped into two of the segments, and the numbers in the remaining four segments were therefore so small as to be meaningless.
The final approach taken was to first use PCA and factor analysis to create a small number of new variables that were linear combinations of many of the original variables. By focussing on the first few components from the PCA, much of the 'noise' within the data was eliminated, but the underlying structure was retained.
Cluster analysis was performed on the factor scores, resulting in the identification of five segments of respondents, with each segment reporting particular attitudes and behaviours. As the factors used for the cluster analysis themselves were understandable, this resulted in meaningful segments.
The Result
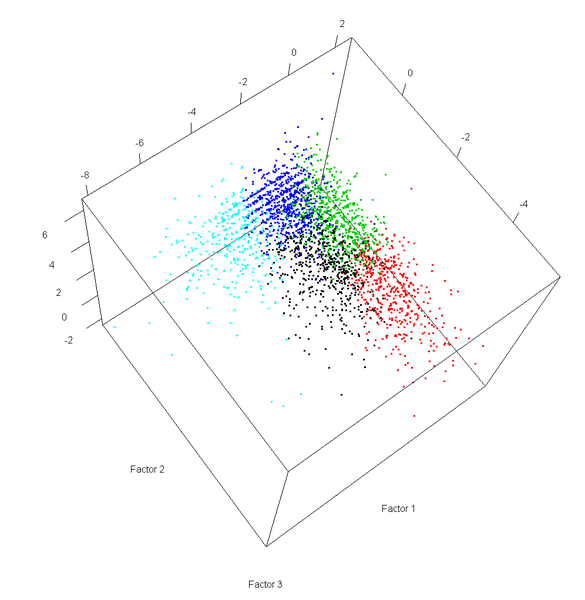
The three factors extracted by the PCA could be interpreted as measures of current financial situation, diversification behaviours and planning attitudes.
- Respondents receiving a high score on the current financial situation factor appeared to have their finances under control, were comfortable with the amount of money they currently owed and felt they could weather a financial storm. Conversely, those receiving a low score on this factor were struggling financially, were likely to have missed payments on debts and were likely to spend most or all of their income immediately it was received.
- The diversification behaviours factor was a measure of how many different types of investment the respondent had and also how many different information sources the respondent made use of in managing their finances.
- The third factor measured respondents' attitudes towards financial planning, and whether or not they considered it important in either the long term or short term.
Five segments were then identified based on understandable differences in these behaviours and attitudes. For example, each segment showed that respondents' attitudes and behaviours towards money management were in sync - people who consider financial planning to be important are more likely to obtain information from diverse sources and have diverse assets and vice versa. Similarly, the results of respondents' attitudes and behaviours were predictable, with those who scored highly on the second and third factors more likely to feel in control of their current financial situation.
The Social Research Centre classified these segments as:
- High income and asset levels but struggling with high debt;
- Savvy investors;
- Conservative with high assets;
- Struggling with low income, low assets, low financial literacy; and
- Struggling with low income, low assets, low financial literacy and high debt.
It was clear that a high income does not necessarily protect people from financial difficulties, indicating a need to ensure advice and/or education are made available to more than just the traditional 'low income' groups. It was also clear that, while some low income households have high debt levels, a large proportion of low income households have managed to avoid debt so far, but are in danger of falling into debt without appropriate advice and assistance. Identifying such households at an early stage is therefore key to improving financial outcomes across the community.
Further analysis was undertaken to establish detailed profiles of the five segments to allow FaHCSIA to identify people who were likely to need assistance and to develop targeted approaches that provide the right forms of assistance. Money management services being offered by the Department can focus on modifying the attitudes and behaviours common to the segments who were identified as struggling.
If you would like to read more about this issue, the full published report is available on the Department of Social Services (Families and Children) website.
March 2012