
Getting the Most from the Census
In the week preceding the 2001 Census, 794,456 people (43.4%) had used a personal computer at home. Of these, usage of a personal computer at home by specific age groups reflected 269,840 people aged 0-19 years (14.7%), 330,163 people aged 20-44 years (18.0%), 171,367 people aged 45-64 years (9.4%) and 23,086 people aged 65 years and over (1.3%).
(A Snapshot of Western Australia, Australian Bureau of Statistics, November 2002.)
It's easy enough to quote these statistics, but what do the numbers mean and what can you do with them?
Australia produces one of the best population censuses in the world. Carried out by the Australian Bureau of Statistics (ABS) on 7th August 2001, the Census of Population and Housing achieved a high level of completeness and accuracy unmatched by many other data collections.
The Australian Bureau of Statistics published the first release of their main Census product, CData2001 in late September 2002. CData2001 is an information tool that combines data from the 2001 Census of Population and Housing with mapping software. Data Analysis Australia has access to this and the similar tools that are available for the 1991 and 1996 Census years. Please contact us for further information.
The Data Analysis Australia Advantage
The Census data is a powerful source of information about people, households and communities if used properly. Data Analysis Australia has been using Census data in various applications since the 1986 Census became available. These applications are solving real problems for clients and have led to a distinctive Data Analysis Australia approach to using the Census.
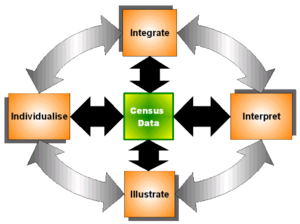
The four key aspects of this approach are integration, interpretation, illustration and individualisation.
- INTEGRATION recognises that the Census data is rarely used in isolation - it may be one of the best information sources but to be really useful it often needs to be combined with other sources of data in a statistically valid way.
- INTERPRETATION emphasises what the data actually means - understanding and communicating the meaning of the data in a real context.
- ILLUSTRATION recognises that information must be communicated - a world seemingly full of data still needs means of presenting a picture in words, maps and graphs.
- INDIVIDUALISED reporting is customised to suit the individual needs of our clients.
Data Analysis Australia's combined skills in applied statistics, data management and experience with geographic information systems as well as our understanding of the needs of our clients means that we can deliver an information service going well beyond the Census data itself.
The examples presented below illustrate how Data Analysis Australia can make use of Census data to assist clients.
- Historic Census data and projections of populations have been used to assist clients to determine the future viability and demand for a redevelopment of shopping centres, community and educational services, or retail outlets. Using data from several Censuses gives an understanding of the changing nature of the catchment area or community.
- Locating specialist services in the community often requires understanding where demand is the greatest or is not being met. Data Analysis Australia combined population statistics from the Census with hospital morbidity data to identify 'hot-spots' for health service needs. Our in-house travel network model was also integrated to determine the optimal location of health services by minimising the time it takes to reach them.
- Another example used information about a client's existing customers collected from a survey. Key characteristics of the high frequency users of the service were determined from the survey results. The location of additional outlets was based on finding other areas in the community fitting similar a profile using Census data.
- Census statistics can be used to support notions that traits of a population are more prevalent in some areas than in others. Regional comparisons of community characteristics based on Census data have shown why service models are successful in some places and not in others. The analysis can identify characteristics of a community where the service model wasn't working to assist in planning a better service.
Data Analysis Australia has built in-house products that incorporate Census data.
Socio-Economic Indicators
Data Analysis Australia maintains a set of Socio-Economic Trend Indicators (SETI), which complement the Socio-Economic Indexes for Areas (SEIFA) developed by the Australian Bureau of Statistics from the Census of Population and Housing. SETIs have been developed for the 1986, 1991 and 1996 Censuses and will be developed for the 2001 Census once the full data is released. A feature unique to SETI is that they have been developed in a consistent manner to allow meaningful comparisons to be made between the Censuses. The indicators currently available are Advantage; Disadvantage; Job skills; and Economic resources, with a Health Needs index in the pipeline.
Each indicator is built by combining Census variables that relate to the theme of the indicator. For example, advantage would naturally be related to households with an income above a certain threshold, whilst disadvantage is likely to be related to households with income below another threshold. Principal components analysis (PCA) is the major tool used to identify variables that provide stable and consistent indices. The indicators are calculated for groups of about 250 households within Australia (Census Collection Districts) and can be aggregated to almost any geographical area.
Since they are geographically based, SETI indices have been used to segment customer databases by linking on addresses (naturally, Data Analysis Australia conforms to the standards set out in the Privacy Act, details of which are available in our last newsletter). Such analyses usually incorporate other customer information as well, underlining the need to consider the Census as just one information source.
Data Analysis Australia can assist you with all your SETI needs and enquiries.
Population Projection Model
The most recent Census describes Australia as it was in August 2001. Most people using the Census - strategic planners, policy makers, service providers and researchers to name a few - need to make decisions about Australia in the future. The link is provided by population models that understand the growing and changing population of Australia. Population models extrapolate actual population counts from the Census for future years and can be calibrated using other information to guide assumptions on growth rates, for example.
Data Analysis Australia developed it's own population projection model in response to the need for a population model that reflected the different characteristics of Australia's ethnic groups. We found that the population parameters for Indigenous populations in many existing models were inadequate, giving incorrect growth parameters for this sector of the population. The model has also been used to consider alternative scenarios for population segments, assuming different migration patterns for example. Currently Data Analysis Australia is updating its models with population and migration data from the 2001 Census.
For further information, please Contact Us.
December 2002