
Spatial Analysis and Mapping
Data Analysis Australia's consultants understand spatial data using best practice statistical analysis including all standard geostatistcal and spatial points process methods. These methods can answer questions from "is this cluster of disease just due to chance?" through to "what is the best estimate of ore grades in this mine?".
Spatial data and information arises in many fields. Some of the areas that Data Analysis Australia has used spatial analysis include:
Human geography, which uses Census data on where people live and how they live their lives;
Mining data, which often has geochemical measurements located in two or three dimensions;
Transport planning that needs to consider what is close to certain routes and how the network is connected;
Ecological data, where records consist of locations of endangered trees; and
Epidemiological data that records the locations of persons with a health condition.
In addition to this, we have up-to-date Geographic Information Systems (GIS) capabilities, ensuring that we make full use of maps as a powerful tool to visualise and communicate research results. Using such packages, our consultants are able to produce accurate and detailed map projections that overlay data from multiple sources.
Data Analysis Australia consultants' expertise in spatial analysis and mapping includes:
Community profiling and demographic analysis to understand the population and resources of particular catchment areas and identify locations with selected attributes;
Locational analysis, used to optimise the location of services and infrastructure by identifying sites with surrounding populations or resources that best match a desired set of criteria; and
Spatial demand modelling, used to determine where services and infrastructure are needed most by locating areas with high demand or gaps in services.
Location, Location, Location
Where should you provide services?
Location is key when it comes to providing a service - it impacts the expected number of customers, profit and performance. There are many things to consider when selecting a service location. Where are the existing services? Who are the expected clientele? Where are the clientele now and where might they be in the future? Data Analysis Australia has the expertise and experience in service placement required to optimise performance in both the short and long term.
Selecting and Interpreting Regions
How do you choose where to analyse?
The Australian Bureau of Statistics (ABS) conducts the Census of Population and Housing every five years, with results made available publically on the ABS website. One might then presume that questions such as “what is the population of Karratha?” can be easily answered at the click of a button. The reality is not that simple. For example, it is important to understand the meaning of “population” and “Karratha”, both of which could depend on many different factors. At Data Analysis Australia we aim to provide the most relevant information to our clients, by tailoring the selection of both the data and region to best meet their needs. Data Analysis Australia takes into consideration factors such as:
Related Case Studies
Spatial Sampling
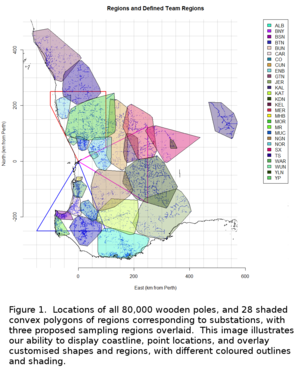
The Problem: The accuracy of Western Power’s database of approximately 80,000 wooden electricity poles, identified for pole replacement and reinforcement, needed to be assessed as part of the assurance at completion of the programme.
The Data Analysis Australia Approach: A sample of poles was selected for physical inspection, taking into account available resources of inspection staff and time available. A compromise was required between time spent travelling and time available for inspecting the selected poles, while achieving a reasonable number of poles sampled from as large and varied an area as possible. Objectivity was ensured by strict random sampling in two stages, forming random clusters for each half-day per inspection team. Geographical coordinates and maps in various forms were central throughout this project.
The Result: The sampling scheme that Data Analysis Australia developed was statistically sound as well as practical and achievable within the available resources. The inspections were completed successfully, and EnergySafety relied on the results.
Dispersal of Asian Visitors to Australia
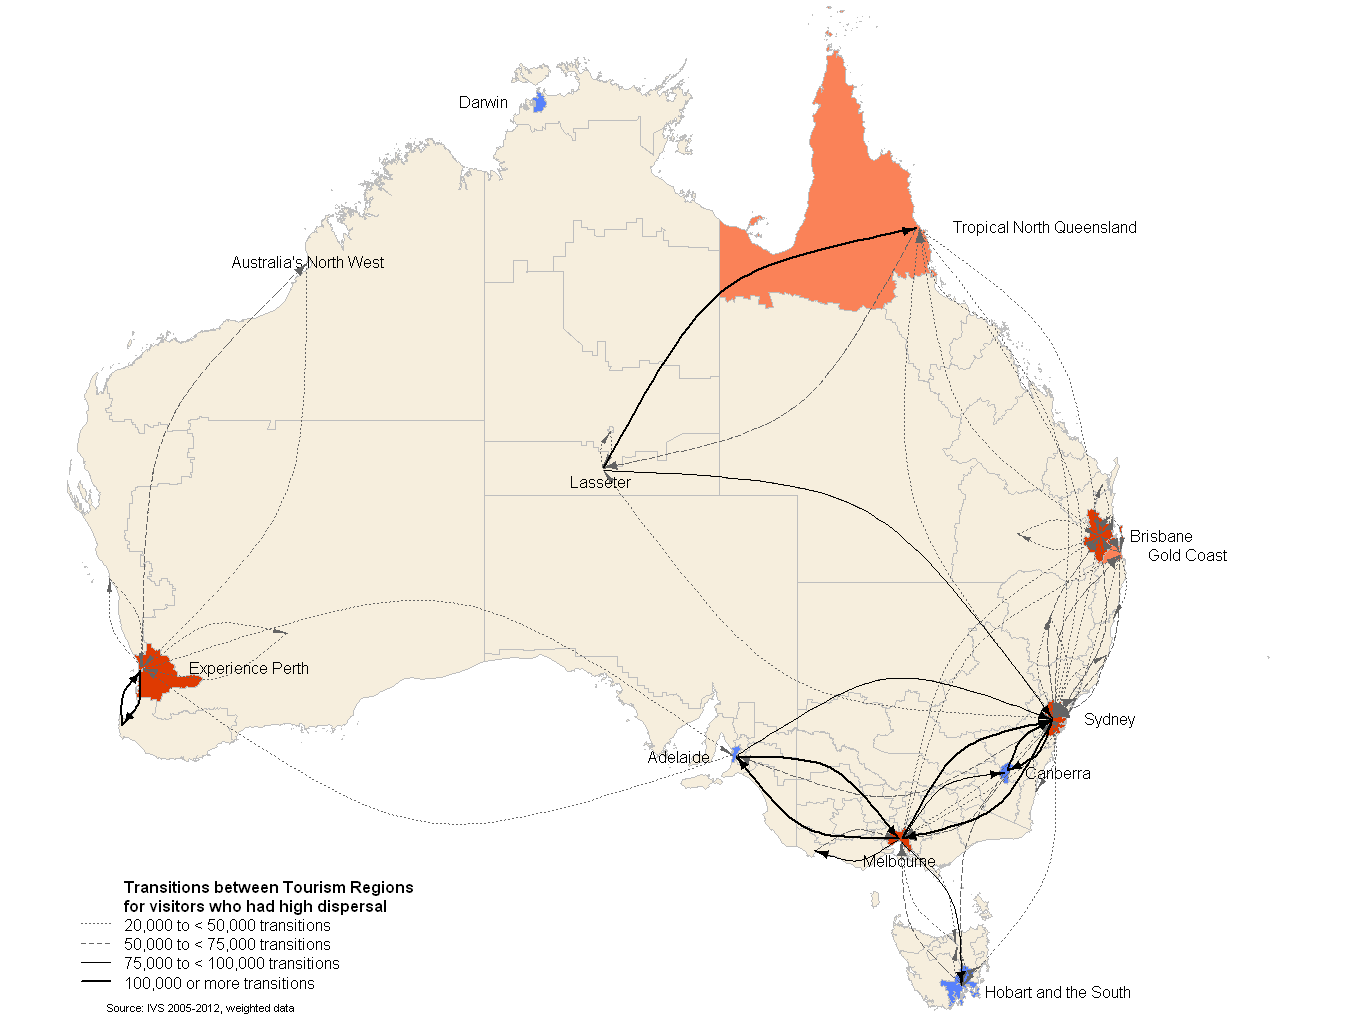
The Problem: Tourism Research Australia wanted to know "where do visitors from Asian countries of residence go?"
The Data Analysis Australia Approach: To investigate the high dispersal class (visitors who went to multiple places and outside of the major tourism regions) using maps and cartograms.
The Result: This investigation showed that even very short trips can be highly dispersed. Many of the regions visited by those with high dispersal are typically on the eastern seaboard centres and in locations where the infrastructure is set up to support such trips.
Statistical Data Science
Analyse, visualise, and model data using the latest statistical and data science techniques
Surveys
Develop, carry out and analyse surveys to understand perception and find business insights
Forecasting and Prediction
Discover trends and predict the future with data
Spatial Analysis and Mapping
Learn how data is spatially correlated to inform strategy
Business and Risk Analysis
Understand how risk and uncertainty can be minimised in business decisions
Big Data and Machine Learning
Uncover trends and relationships to gain valuable insights from big data
Simulation and Optimisation
Determine the optimal way to operate in the future
Mining Analytics
Improve processes and uncover new insights
Interactive Dashboards
Make informed decisions from real-time data with intuitive visuals and information