
Hockey Sticks, Climate and Statistics
Much of the public debate about climate change revolves around whether there is evidence of increasing global temperatures due to man's impact. In the media it is portrayed as a clash between believers and sceptics, with these groups largely defined by their attitude to this evidence. The intensity of this debate seems to have left no middle ground and much of the media discussion is now about what the public think and the political implications rather than what might be right.
This should be a scientific debate, aiming at finding the truth, not trying to prove preconceived positions. By their training, scientists are normally careful about any evidence until it is well established, and they talk of working hypotheses rather than beliefs. They move forward slowly, gathering evidence. However the complexity of climate research clashes with the need to make decisions as early as possible if some of the predictions of climate change are correct. It is a position that the scientific culture is not comfortable with so it is not surprising that it has not been handled well.
As professional statisticians, we see this debate in a special light. Statisticians are trained in collecting and assessing data and advising on how decisions might be based upon it. Statisticians naturally ask questions such as "how accurate are the measurements?" and "is this a real data point or an estimate?". Statisticians also try to quantify the probability of making the right decision.
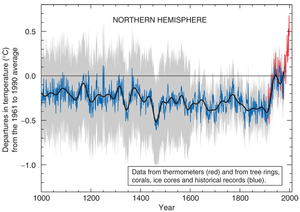
Much of the debate is around the graph by the American climatologist Michael Mann and his colleagues. This graph, often called the "hockey stick", shows historical temperatures over the past millennium. The graph shows relatively stable temperatures until the middle of the twentieth century followed by an upward trend of a type not seen before.
The statistician asks where this data came from, especially prior to 1850 when modern thermometers became standard. The answer is that these are composite estimates based upon indirect measures or proxies such as ice cores and tree rings. Statisticians do not object to estimates, but do insist upon knowing how they are calculated and how precise they might be. The commentary does not tend to state whether these are ±2 degrees or ±5 degrees - important when judging the significance of the hockey stick.
The data since 1850 is also not without problems. The curve tries to give global (or northern hemisphere average) temperatures, but must be based on measurements at many individual locations on the earth, and few of the locations have a continuous record. These temperatures are also estimates - more accurate than the estimates before 1850 but are estimates all the same. At Data Analysis Australia we can relate this debate to our own work. In many areas of human activity ranging from road safety to energy use, the weather is an important explanatory variable. If a drop in road crashes occurs, our analyses have been used to correct road crash rates for weather effects so that real trends can be determined. Similarly, subtle differences in temperature can lead to economically significant changes in electricity consumption. Our experience shows that setting up a weather record for a single region for forty years is difficult, so the global challenge over centuries is daunting.
Using such data requires a high level of statistical sophistication. The original work by Mann used standard statistical techniques such as principal components, but apparently did not have input from professional statisticians. This does not mean that it is wrong, but it does highlight that the data used should be openly available and analysed by the statistical community.
Recent controversies about the data used in the Intergovernmental Panel on Climate Change (IPCC) reports will doubtlessly lead to better examination of the data and other aspects of the science. However political decisions will still need to be made with some uncertainty remaining. Understanding the uncertainty with the risks of not acting and the risks of acting, will be critical. Neither waiting for perfect data nor pretending the data is perfect are sensible options.
For further information, please Contact Us.
February 2010