
Statistics In Space
Almost every measurement has a "where" attached to it. The Census collects data from households, the where being the household address, environmental samples are collected from a specific site and geological samples taken from a drill hole have a position in three dimensions.
To a statistician these spatial aspects can be critical, not only in understanding the data, but to collecting good data in the first place. The obvious reason is that the positions themselves may be of interest. For example, if monitoring for pollution the spatial element is critical when relating back to potential sources. A less obvious reason is that samples close together in space are likely to be similar to each other, affecting the information content and what inferences can be made. This means that even something as ordinary as a political poll can be made more efficient if spatial relationships are considered.
Telephone surveys often use a randomly selected sample from a listing of telephone numbers in the area of interest (often an electorate or suburb) with no further consideration of the spatial aspect of the sample. However, people who live close to each other will face the same local issues and are likely to provide similar responses. People who live further apart will face different issues and therefore provide different information. For example, if you ask three people in the same street about the state of footpaths, you are likely to get three similar answers and asking a fourth person from that street is unlikely to provide new information. If you instead ask a fourth person from several streets away, you may get a very different answer - which provides you with information on the variation within that suburb. In a statistical sense, more information is obtained by surveying the people who live further apart from each other.
This can be built into sophisticated sample designs. A simple way is to break up the original listing into smaller geographical areas, such as Census Collection Districts, and ensure that sampled households are spread across all areas. Alternatively, a systematic procedure can be used to force sampling points apart, increasing the statistical value of the information collected and obtaining a similar precision from a smaller sample. Data Analysis Australia assisted in the design of the Household, Income and Labour Dynamics in Australia survey, one of the biggest survey projects in Australia, by ensuring a reasonable physical spacing between clusters of households. To achieve the same precision by increasing the sample size would have cost millions of dollars more.
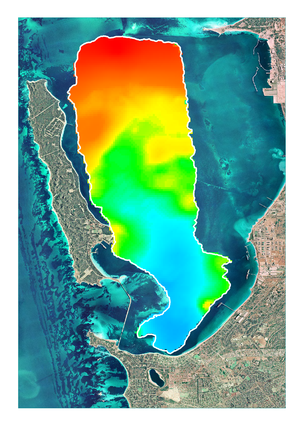
Once the data is collected, there are several analytical techniques, which come under the heading of 'geostatistics', that can be used to examine spatial relationships. These measure the strength and extent of spatial relationships, and form a logical framework for interpolation and understanding. Data Analysis Australia recently used geostatistical techniques in this way for the analysis of biological communities in Cockburn Sound, identifying areas of high and low diversity as illustrated on the right.
We have also used geostatistics to gain an understanding of the accuracy of emissions measurements collected from an industrial plant. While this involved analysing temporal relationships, to a mathematician time is simply another dimension of the data, and the same techniques can be applied. The results of this analysis have allowed informed decisions as to the most appropriate way to measure changes in emissions over time.


February 2007