
When Can You Ignore It?
Everyone has to face information that they would rather not see sometimes. It might be a speeding ticket or their weight. It might be the result of a survey that gave results that they are not comfortable with. One course of action is to ignore it but that is not always the right or the best action. Sometimes the unpleasant information is a critical warning that must be heeded.
More importantly, ignoring facts can damage credibility. In Court, the requirement is to give "the truth, the whole truth and nothing but the truth". This is also the rule in science where all the results of an experiment must be presented.
When analysing data, these problems arise in the form of values that were not expected or do not fit well with your model of how things should be. The statistician calls these outliers. Can those data values be ignored as "obviously in error"? Or are they actually warnings that contain important information?
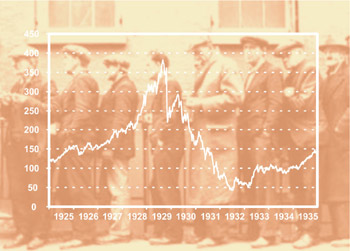
The Depression of 1929-30 is an example of economic time series data. It did not fit the pattern of any previous economic data and clearly conflicts with many of the mathematical models currently used by econometricians. But the Depression was real and perhaps taught us more about the world economy than any other event of the last century.
There are situations where some data must be ignored, or at least downplayed. For example, when statistics on house prices by suburb are given, it is usual to give the median price, not the average. This recognises that averages can be seriously affected by one or two extreme values and hence not give an accurate indication of the typical price. The median, which is simply a value that has half the data on each side of it, uses the information that these high prices exist but ignores their actual values.
Every time information is ignored, it is valid to ask whether it was appropriate to do so. Simply that it was inconvenient is not a good excuse and detracts from the credibility of the analysis. Not surprisingly, it can raise questions of objectivity and integrity. There is no substitute for being methodical and documenting why decisions are made the way they are. If it is believed that the data is in error, it is good to have some idea of how the errors may have been made.
Again, the Depression is an example of this. Every time an economic forecaster ignores it - saying in effect "it will never happen again" - they are understating the risks or uncertainties in their forecasts.
These are issues that statisticians grapple with every day and tools have been developed to help. For a start, statisticians have clear ideas of random variation and thus ways of deciding whether a data value is reasonable or unreasonable terms of the context. Some of these methods have become highly systematic, including ones that build a natural caution into the analysis while minimising how much information is lost - this is the area of robust statistics. The median is just one example of a robust statistic.
Another strength of statisticians is in recognising the bias that might be introduced by leaving out data. For example, the distribution of the original data might be skewed and removing extreme data points can lead to the distribution of the refined data set to be centred.
However, these methods do not remove the responsibility to ensure that it is appropriate to ignore some information. If anything, the use of robust methods increases the risk that poor decisions are made since they are automatic. In the end it is the professional responsibility of the statistician to say what data must not be ignored, even when such a statement is unpopular.
April 2006