
Football Analytics – The Smarter Game
Dr. Emma Black, Senior Managing Consultant
Football (soccer) clubs are big businesses - in 2018 Manchester United was valued at over $1 billion. They rely on strategic insights to make sound decisions.
A key part of this revolution of the game is performance analytics. By recording match data and applying data science techniques, advantages and weaknesses that are too subtle for even expert viewers can be identified in seconds. Insights and recommendations are provided in real time during the game, not just following hours of post-match video review.
Working with the Floreat Athena Football Club (FC) as the Head of Analytics, I’ve developed a customised and flexible analytics program providing real-time strategic advice. Under this program, our first team now has an ~80% win rate and in March we took out the 2019 Night Series title!
My Role at Floreat Athena FC

I’ve recently semi-retired after an 11 year playing career in Perth’s elite football leagues, and have over 10 years’ analytics consulting experience at Data Analysis Australia. I naturally transitioned into football analytics when the opportunity arose.
With four league championships, six association cups and eight night series trophies in the cabinet, Floreat Athena FC is a highly respected club in the National Premier League in WA.
I assess performance; provide insights and offer direction during the game; and then give a detailed review afterwards to inform tactical decisions.
Game Day
Providing real time statistics to the coaching staff is challenging. The game is fast moving, meaning data collection is crucial and can be difficult.
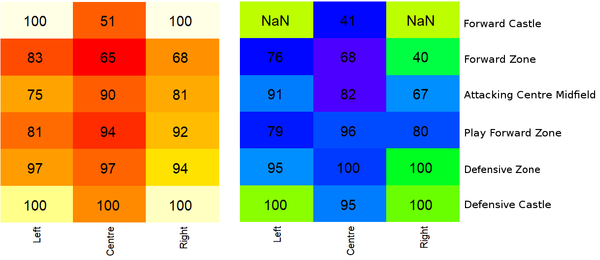
I track movement of the ball for each team by location on the pitch, which is split into 18 (adaptable) zones – left, centre, right and six horizontal areas. Using this data, my program creates heat maps based on use of each zone and overlays the percentage of possession retention – how often the ball stays with the team. For the home side, the example figure shows:
- A higher tendency to play the ball into their left hand side of the pitch – indicated by darker highlighting in the heat map on the left hand side.
- The attacking left wing is winning the battle against the opponent’s defensive right - indicated by the difference in percentage retention of the ball in the forward zone – at 83% on the left and 68% on the right.
Providing data at 15 minute intervals and at half time, my work enables coaches to react strategically, make smarter decisions and win games. In this example they might instruct players to use the left side even more, or make a substitution in the attacking right to lift performance. The cool map in the figure above shows the opposition has an even greater tendency to use their left wing more than their right. It also shows low possession retention rates on their right – at 67% in the right Attacking Centre Midfield and just 40% retention in their right forward zone. A home side tactic may be to defend across the Play Forward Zone and Attacking Centre Midfield in such a way to encourage/force the opposition to play down their weaker side.
The heat maps are just one aspect, other statistics that I produce include:
- Success rates for penetrating opposition defensive lines;
- Directions of passes (what percentage are being played forward as opposed to neutral or backward);
- Number of times the teams enter dangerous scoring zones (known as the Castle);
- Percentage of possession, total and in each half;
- Conversion rate (goals per shot); and
- Other basic count information for shots, chances (without a shot achieved), goals, corners, free kicks, substitutions, etc.
After the Game – What’s the “Full Story”?
Within 48 hours after a match, the coaches meet with the team to review performance and to plan for the week ahead. I will assess performance by the different metrics, compare with previous matches, look at the upcoming fixtures, and provide a relevant, focussed, strategic plan. I consider:
- Which metrics have been constant throughout the game, or across games?
- Which metrics are highly variable?
It is important to understand where variability is coming from. For example, if a team’s success rate for penetrating opposition defensive lines has been inconsistent, I delve into the detail to see which situations are the most favourable.
- Is a “vertical” ball (playing straight down a line) more successful than a switch (moving the ball from one side to the other)?
- Is the team more successful once they have already worked the ball into the forward half, or are “long balls” forward from our defence leading to goal scoring opportunities?
After reporting at the team and strategy meetings, I adjust any data recording procedures or program code as required and then move on to the next game!
About the Analyst
Dr. Emma Black is a Senior Managing Consultant Statistician at Data Analysis Australia. In her ten years at the company, she has earned a reputation amongst her clients and colleagues for a dynamic work ethic and commitment to problem solving.
Emma has been a State League football (soccer) player in the local Perth leagues since 2008, has experience and/or training as a Captain, Coach, Manager, Divisional Representative and Referee at this level, is a former National University All-Star in outdoor 11-a-side, and a former Western Australian representative in futsal. She is currently the Head of Analytics with Floreat Athena’s National Premier League (NPL WA) squad. Emma can be contacted at emma@daa.com.au
2019