
Response Rates
We are all aware of magazine and television "surveys" where the public is invited to write or phone in to give their opinion on a current issue. Often the results are extreme. This is partly because only a very small proportion of the public who could participate actually do, and those who do often come from a particular viewpoint. These are examples of surveys with a very low response rate, often well under 1%. They represent an extreme example, however many other surveys also suffer from low response rates, and their results may also be misleading.
In contrast, some surveys are quoted as having a "high response rate". But what exactly is a response rate? And how does it influence the quality of the survey results?
The response rate of a survey is a measure of how many people approached, (i.e. 'sampled') actually completed the survey (expressed as a percentage from 0% to 100%). It is usually assumed that the higher the response rate, the more likely the results are representative of the population, provided the sampling is appropriate in the first place (and that people who don't respond are roughly the same in their opinions as the people who do respond).
Most people assume that if everyone approached took part in the survey then the results are representative. Actually, it depends on the way that the sample was designed. Sampling theory establishes procedures to ensure samples are chosen to avoid biases and, just as importantly, quantifies how different a sample might be from the whole population.
Response rates are strongly affected by the method of data collection. In general, the more interaction between the potential respondent and the people collecting the data, the higher the response rate. There are at least four common data collection methodologies:
- Self-completion and mail back
- Telephone interview
- Face-to-face interviews
- Internet questionnaires
Self-completion surveys often have lower response rates than telephone or face-to-face interviews, because the respondent is left to return the survey. It is also more work for the respondent, as they have to fill in the questionnaire themselves without assistance, and then return it to the research company.
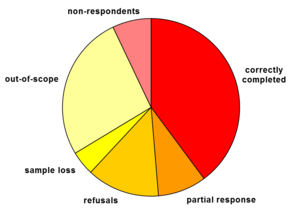
When someone is approached to participate in a survey, there are a number of possible outcomes. This is an area of survey theory with confusing and sometimes conflicting terminology, but a reasonable set of definitions are:

The last group can be the most problematic and it is often subdivided further so that a better understanding can be obtained. It may also include people who should not have been surveyed in the first place, but were not identified as such. For a mail-out survey this includes incorrect addresses, non existent addresses, and people who are away for the duration of the survey. These may or may not be considered out of scope, as we do not know whether they would have completed the survey had they been successfully contacted. Another common form of response is the "partial response", where the survey is returned but not all questions were filled out properly. These surveys are subsequently classified into valid responses or refusals based on the way the survey is being run and the amount of information provided. For example, a survey about toothpaste brands which only has the demographic information section filled in (age, gender, household income, etc) is not useful in deciding which brand is more popular - it is effectively a refusal.
Calculating Response Rates
The different types of responses must be taken into consideration when calculating response rates. It is not as simple as dividing the number of completed surveys by the total number sent out - out of scope and sample loss need to be considered in the calculation. Unfortunately some surveys give misleading figures for response rates due to "creative" definitions of non response.
One problem is that it is not always easy to differentiate between out of scope, sample loss and refusals and this can give misleading response rates. For example, if no response is received for a mail-out survey, it can be difficult to tell whether this is because the respondent has simply not completed the survey (not a refusal) or the address was incorrect and the questionnaire was not delivered (sample loss which may or may not be considered out of scope) or, because the person who received the survey has realised that they were not in the target population (out of scope). For telephone surveys, refusals are easy to recognise, but identifying the difference between sample loss and out of scope may still be problematic.
The most common ways of dealing with ambiguous outcomes depends on the survey type.
- Mail-out surveys that are returned as "not at this address" are considered to be out of scope.
- For telephone surveys, uncontactable numbers are generally considered as out of scope.
- For face-to-face surveys, if the dwelling appears unoccupied, (as distinct from no-one at home) this is commonly treated as out of scope.
Once the method of dealing with non-response has been decided the response rate is calculated as:

In all cases, it is important to be aware of what has been considered as out of scope. It may not matter, as long as the types of non-responses are known and a consistent method is used.
Why do we want a High Response Rate?
While the most obvious reason why we want a high response rate is to provide a return on the investment in the survey, there is a more important statistical reason. If the people who didn't respond to the survey are different to those who did respond, then the results may be biased. For example, if everyone who responded to a survey about a new product said that they liked it, it generally indicates that it is likely to be a very successful product. However, if only people who liked the product responded to the survey, the results would be misleading or biased. If the response rate was 80%, and all the people who didn't respond (20%) hated the product, you still have 80% who liked it. If, on the other hand, the response rate was only 20% and the non-responding 80% hated it, the product is unlikely to be successful.
In general, a high response rate is likely to reduce such biases, however it is important not to overlook other types of bias which cannot be overcome by achieving a high response rate. If you conducted a self-completion survey of literacy levels it is highly likely that potential respondents with low literacy levels would not respond. In this case even a response rate of 95% would not guarantee that the results were free of bias because the data collection methodology chosen was inappropriate.
A real life example is found in the National Indigenous Preschool Census conducted by Data Analysis Australia for the Australian Government. The aim is to measure the participation of Aboriginal and Torres Strait Islanders in pre-schooling through a survey of preschools. The preschools that are least likely to respond to the surveys are the remote, hard to contact, community-run ones - precisely those with the highest numbers of Indigenous children. Consequently a response rate less than 95% is considered poor!
Conversely, a low response rate does not necessarily mean that the results are biased. As long as the non-respondents are not different in terms of how they would have answered the questions, there is no bias. Of course, showing that the non-respondents are not different is hard to do, because you don't know how they would have answered the questions. There is a method called a non response survey that can assist in understanding non-response bias.
Increasing Response Rates
There are many and varied ways to increase response rates, but these must be carried out with care to ensure that they do not introduce other biases. They include:
- Pre-contact. Phoning or sending a letter, email or fax to inform respondents about the survey or to set up an interview. It often helps if this letter is from someone who can be trusted, typically from the organisation commissioning the survey.
- Questionnaire design. Minimising the length and difficulty of the survey, simplifying the format, ensuring questions are not ambiguous and have clear instructions and only ask what is necessary.
- Follow up. Phoning or sending a letter, email or fax to people who haven't responded within a certain time. Multiple follow-ups may be needed. Unique identifiers on each survey form are generally required for this method, so you can send reminders to those who haven't responded, rather than a general notice to all people in the sample. Unfortunately, IDs on surveys may possibly lead to an initial lower response rate as some people feel they jeopardise the confidentiality of the survey.
- Incentives. Offering a raffle prize to people who respond to the survey or an up-front gift/payment/voucher to everyone approached. The form of the incentive may cause bias because particular groups may find it more appealing than others. Incentives that require people to identify themselves on the forms can possibly lead to untruthful answers or a lower response rate.
- Timing. Avoid Christmas, Easter and other holidays.
- Method of implementation. Don't run the survey online if the sample does not have good email coverage.
Some or all of these methods can be used to improve your survey response rate, but there are costs involved and these need to be considered. You can compensate for an expected low response rate by implementing one or more of the above methods. Measures must be taken to ensure that enough data is collected for the data to be useable, however in the end, it is a trade off between the cost of running the survey and the response rates that can be achieved.
If you are looking at survey results, ask yourself a few key questions. What is the response rate? How was it calculated? What is included/excluded? A better understanding of response rates can help in appropriate use of survey results.
September 2005