
Weather Statistics: Are Averages Useful?
On 1st December 2010, the ABC reported that, according to Bureau of Meteorology (BOM), Australia had had a bumper spring for rainfall, 160mm on average across the land - about 100mm more than last year. On average that is a lot of extra rainfall and it would suggest that there has been sufficient rainfall in all regions of the country. However, is providing an average for the whole of Australia at all meaningful and, if not, why state it? For instance, if you live in the South West of Western Australia it is not at all comforting to know that on average there has been sufficient rainfall when this region has had an extreme dry period. In fact, according to BOM the South West has experienced its "warmest spring on record and its driest year on record". So, providing an average really fails to hammer home the issue of the variability across Australia, from state to state or even between the north and the south of Western Australia.
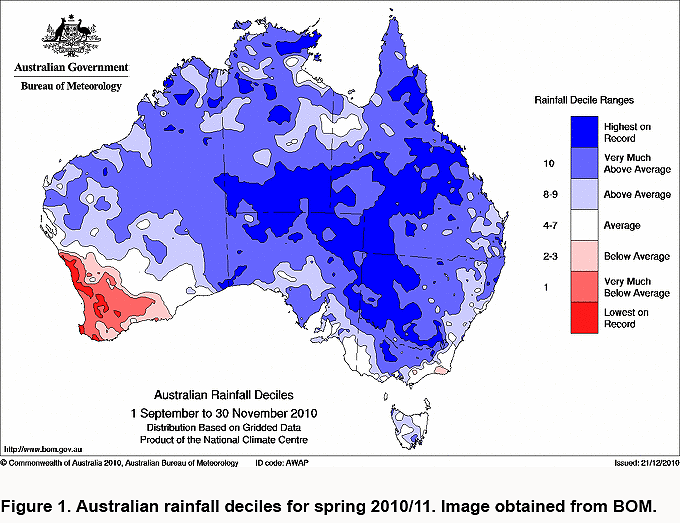
To show just how variable rainfall is around the country we can look at the map below which shows the rainfall deciles for the country and highlights areas that have had above and below average rainfalls from 1st September to 30th November 2010. It is clearly evident that the whole of the South West, ranging from Geraldton to Esperance - an area larger than the state of Victoria - has had "Below Average" rainfall, with much of it either very much below average or lowest on record. This is in stark contrast to the rest of the state, and indeed the rest of the country, which have seen a significant increase in rainfall.
Should we expect more from weather reports? The ABC article fully ignored the dire situation caused by drought being experienced in the South West, yet the original BOM seasonal climate summary for this period stated that "Despite the widespread wet, there were areas of Australia which received below average rainfall. The southwest region of WA, south of a line stretching from just north of Geraldton, down to just east of Esperance had falls in the lowest 10% of records with much of this near the western coast having lowest on record falls." Unfortunately this wasn't included in the original ABC article and so it did not communicate the real message for WA, which was that whilst there had been a significant increase in rainfall for the north of the state, in the South West, where the majority of the population is, there had been a severe lack of rainfall throughout spring, posing a major concern for water supply.
Why the Confusion?
The problem is that an average rainfall figure for the whole of Australia, or even for a State or Territory, provides little information and can, in fact, mask the significant regional variations present.
Now this is not entirely the journalists' fault. They are reporting the situation (more or less) as given to them by BOM. The issue is the methodology that BOM uses for calculating regional rainfall - a methodology optimised for calculating average rainfall over an area. It is essentially a grid system, where all weather stations' rainfall observations are averaged over each grid to provide the rainfall for each grid. BOM uses a weighted average by area, which allows them to calculate average rainfall over a region that may be sparse with rain gauges. The grids are 0.05 x 0.05 degrees or about 5 x 5 km in size. This in turn is then used to generate maps like Figure 1 and statements that the average rainfall is 160mm. Data Analysis Australia believes this methodology is appropriate for calculating average rainfalls over these grids.
However, BOM's methodology described above does not take into consideration population or areas of agricultural importance. As Australia's population is highly concentrated to the major cities on the coasts with smaller regional centres in each state, there is very little population over large tracts of the interior. Whilst regional average rainfalls and maps like Figure 1 can prove very useful for these very localised and isolated communities, they don't necessarily provide an explicit picture of what is affecting the larger population centres. For instance, if a person who was ignorant of the Australian geography and distribution of population centres viewed Figure 1, they might feasibly assume that large tracts of the country have experienced more than sufficient rainfall. As Australians, we understand where these population centres are and know which areas of the map to examine more closely to appreciate the variations in rainfall as it relates to population. But it is only with this additional information that Figure 1 can be fully understood.
What Can be Done: A Statistician's Perspective
It becomes apparent that there is a need for a new way of weighting these rainfall figures, to take into account how much rainfall is falling over population concentrations (including their water supply catchment regions), to better inform both the public and policy makers on the current situation. Such a weighting system would not be purely driven by population density - there are other factors to consider, such as agricultural areas (e.g. the Wheat Belt or the Murray-Darling basin), that might need a higher weight due to their importance to the Australian people and economy. In any event, a weighted average for the country or individual states would allow greater appreciation of trends in rainfall where they most affect the population, better informing public debate and business decisions.
March 2011