
Change is inevitable, but is it real?
Everything changes eventually - even good things must come to an end. But when looking back, it is rarely straightforward to pin down the exact timing and nature of change. When did a recession begin? When did a native animal population start to decline? When did a processing plant start operating differently?
At the time it occurs, change is often lost amongst the normal variation and it is only inretrospect that it is evident that a change has taken place. Drawing the line between expected variation and significant difference (that is, deciding whether a change has actually occurred) is a statistical challenge.
Conducting tests to determine whether a change of a known type has occurred at a known time is a standard task in statistics. However, our clients have often asked us to identify sequences of changes over time, where the number of changes and the timing of those changes are not known in advance. This requires identifying breaks in the sequence of data.
Historically, this was regarded as a difficult problem. Advances in statistical and mathematical theory provide clarity in determining how many breaks have occured and have led to faster algorithms. While improvements in computers and software make such tasks feasible, and though this adds an element of automation, they still require statistical care, particularly when modelling data. This is where the experience of Data Analysis Australia consultants makes the difference.
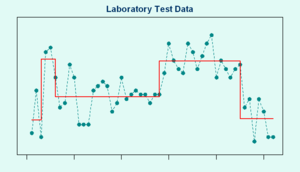
As an example, Data Analysis Australia recently assessed laboratory test data for aclient to ensure the results were consistent through periods that had no changes in procedure. Were there any unexpected changes? The figure above shows that the optimal breakpoint selection included several step changes. As these changes did not always line up with variations in the test subject, the client was able to identify where their results were being affected by uncontrolled factors over time.
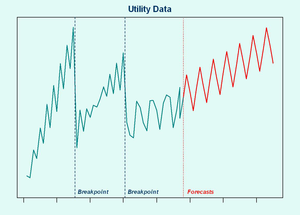
In another example, a major utility required automated forecasts of operational data to understand when assets would need to be upgraded to meet demands. Here the challenge was how much historical data to use - going back too far would no longer reflect current conditions. Data Analysis Australia used breakpoint detection methods to determine when current operating trends had commenced, using the most recent breakpoint.
The fitted model for the data segment corresponding to the current trend period was subsequently used to compute forecasts of the demand that would be expected if this trend was to continue. This is illustrated in the figure to the right. Data Analysis Australia was also able to identify underlying seasonal components in the trend to produce forecasts to a finer precision and to even check whether the seasonal variation had changed at the breakpoints.
Identifying that no change has occurred can sometimes be as crucial as identifying change itself. Breakpoint analysis can be utilised to detect both change and the absence thereof, and is just one of many statistical techniques that Data Analysis Australia employs.
For further information regarding breakpoint analysis, please Contact Us.
September 2011