
Evaluating the Perth Solar City Program
Overview
The Problem:
- Data Analysis Australia was contracted by Western Power to determine the effect of several interventions aimed at reducing households' energy consumption. Electricity consumption data was provided for approximately 30,000 households over several years, with a mix of detailed half-hourly readings from Smart Meters and two monthly billing-period consumptions.
The Data Analysis Australia Approach:
- To derive a sophisticated statistical model describing the patterns of electricity usage for each household before and after the intervention period and apply this to participant and non-participant (control) data collectively, providing an analysis equivalent to a Before-After Control-Intervention (BACI) analysis.
The Result:
- Most interventions had a statistically significant reduction in household energy consumption with the lowest consumption from households with energy saving systems installed (solar photovoltaic and solar hot water) followed by households with behavioural change interventions.
The Perth Solar City Program
The Perth Solar City program managed by Western Power is an initiative to help households to reduce their energy consumption through a number of energy efficiency initiatives, including solar energy and new network technologies, through to education and behaviour change programs. It is a multi-faceted program funded by the Australian Government’s Solar Cities Initiative and the Perth Solar City Consortium led by Western Power with other local industry leaders including the Botanic Gardens and Parks Authority, the Eastern Metropolitan Regional Council, Mojarra, Prospero Productions, Solahart, SunPower and Synergy.
Perth Solar City Annual Report 2012 can be downloaded from here and includes Data Analysis Australia’s report as an Appendix.
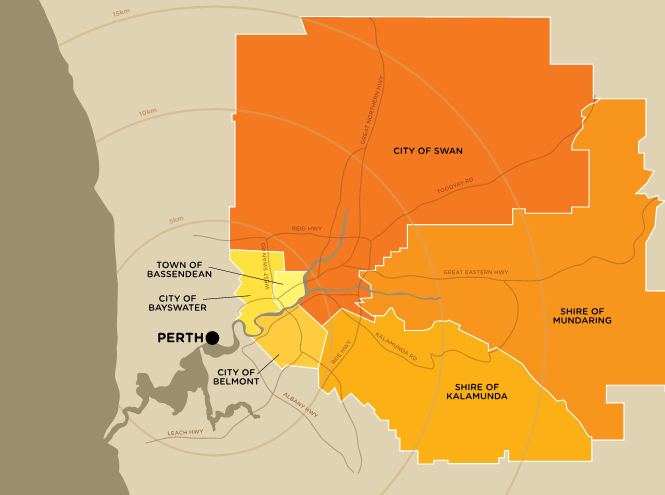
Households in Perth’s eastern corridor, which includes the Town of Bassendean, City of Bayswater, City of Belmont, Shire of Kalamunda, Shire of Mundaring and the City of Swan were targeted under the Perth Solar City program (as seen in the image at right).
Several different types of intervention were implemented, including education and mentoring, installation of high-tech devices, subsidised installation of solar hot water systems and photovoltaic solar power systems.
Some interventions were applied to selected groups of households, with other households in the same or neighbouring suburbs continuing without the intervention so that valid comparisons could be made. Other interventions were voluntary with invited households choosing whether to opt in. Different households participated in different combinations of interventions, and it was the role of Data Analysis Australia to disentangle the effects of the different types of intervention and estimate their effects.
The Interventions
The following interventions were applied:
- Living Smart – an education and behaviour change program via phone-based eco-coaching; provides a pathway for other interventions.
- Home Eco-Consultation (HEC) – personal customised consultations in people’s own homes to provide electricity-saving information; typically applied with one or more other interventions.
- In Home Display (IHD) – a high-technology device that displays the amount of electricity used by different appliances in the house as they are being used; allowed users to be aware of their electricity usage.
- Solar Photovoltaic Systems (PV) – solar power generation by the household that can feed back into the electricity grid.
- PowerShift – a voluntary time-of-use tariff that, via financial incentives, motivates consumers to shift the timing of their electricity consumption to off-peak times when electricity generation is cheaper.
- Solar Hot Water Systems (SHW) – solar hot water systems were installed to replace electric systems.
The Data Available
Data Analysis Australia assembled electricity data for approximately 30,000 households over a number of years, producing almost 135,000 household-years of electricity data. A substantial proportion of this was very detailed half hourly readings from Smart Meters. The analysis needed to account for the several interventions undertaken by each household and changes over time.
Data from non-participating households, both within and external to the target area, was also included to provide comparisons. In statistical parlance these are known as “controls”. Households were also followed from before the period of interventions, which enabled patterns to be established for different households.
Complexities in the Analysis
Electricity data is notoriously irregular and has complex structures both over time and between different households and suburbs. The fact that electricity was measured only approximately every two months in some households but every half hour in households with Smart Meters was another complicating factor. In developing a model for the analysis, Data Analysis Australia faced numerous challenges including:
- Sophisticated statistical models allowing for a combination of factors affecting electricity consumption;
- Complex data set;
- Variation in electricity consumption between households and over time;
- Dealing with meter readings over very different time-intervals; and
- Several different interventions considered individually and collectively.
Data Analysis Australia’s Approach
A statistical model was derived to describe the patterns of electricity usage in each household, consisting of a mathematical equation relating electricity consumption to various explanatory variables, and a description of the variability in the consumption data according to a statistical distribution. The model was very complex, incorporating terms for long term trend, seasonality in demand (both over a year and during a week), the effects of weather and, of course, the interventions and combinations of interactions.
Multiple interventions were included in the one analysis, with special terms to allow for the fact that the combined effect of two interventions applied simultaneously might be smaller or larger than the sum of the two intervention effects if applied individually. In statistical terminology, this is known as an interaction between the two variables.
The fact that interventions were applied at different times and sometimes were applied over a period of time (such as for education and mentoring), were added complications. Interventions such as installation of solar hot water systems can be expected to have an immediate and on-going effect, whereas some other interventions are active interventions for only a limited period, and it is possible that the effect of such interventions might not persist to its fullest extent after the intervention ceases.
The model was applied to the participant data and the non-participant (or ‘control’) data collectively. This provided an analysis equivalent to a Before-After Control-Intervention (BACI) analysis as is commonly used in evaluations. That is, we analyse data on households before and after the intervention period, for both households that received no intervention and households that did receive an intervention, observing all four combinations. The Before–After aspect means that households provided their own controls, however, independent controls (the Control–Intervention distinction) in the same time-period, provided a means of allowing for other effects such as tariff changes, trends in appliance use and the weather that may have impacted on all households.
Result
The overall findings were that most interventions had effects that were both statistically significant and practically significant on total household consumption. Solar photovoltaic systems provided the greatest overall saving, followed by the installation of solar hot water systems, and then behavioural change interventions. Interestingly, the In Home Displays (IHDs) had minimal effect on their own, but did have a beneficial effect when used in conjunction with the PowerShift tariff. An interesting additional outcome from the statistical analysis was that an estimated 1.6% saving was achieved due to the diffusion or ripple effect, whereby households in the target area were influenced to reduce their energy demand even though they were not formal participants in any of the interventions.
Of key importance to the Perth Solar City Program team is that the findings were statistically valid and reliable, taking into account the substantial statistical (and other) complexities of the program.
June 2013