Measuring Advertising Effectiveness
Overview
The Problem:
How to measure the effectiveness of advertising campaigns directed at consumers reducing consumption? (in this case the 'Use Water Wisely' campaign)
The Data Analysis Australia Approach:
To remove the effect of cyclical factors such as weather using the Fourier Approach
The Result:
A direct estimate of the effect of the advertising campaign
The Problem
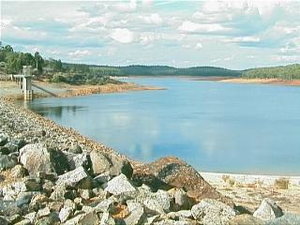
The Water Corporation of Western Australia sometimes faces a perplexing problem - their customers demand too much of their product!
When the product is a public resource such as water and it is in short supply, advertising is used to encourage customers to economise. The "Use Water Wisely" campaigns are one of the most public faces of the Water Corporation.
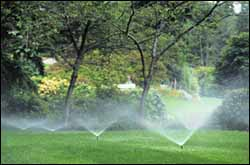
However, how do you measure the effectiveness of such campaigns? The situation is so unusual that traditional market research methods are difficult to apply. To add to the problem, water use is strongly dependent upon factors such as the time of year and the weather, since most water is used on gardens.
Despite the difficulty in measuring the effect, it is essential to assess whether the advertising campaigns are working to plan effectively.
The Data Analysis Australia Approach
Rather than take a marketing research approach to the problem, such as measures of advertising recall, the best approach was to directly measure how advertising impacts upon water consumption.
For some complex modelling problems the most effective approach is to think about what should not be there. In this case, the key to measuring the effect of advertising lay in removing the effects of other factors such as:
- weather,
- weekly cycle; and
- time of year.
With these factors removed, the impact of advertising becomes clearly defined.
In practice, an even better method is to model the factors of interest - advertising - and the nuisance factors simultaneously. This is not only more accurate but it also provides a basis for distinguishing between what is significant and what is not. This is done using a regression technique.
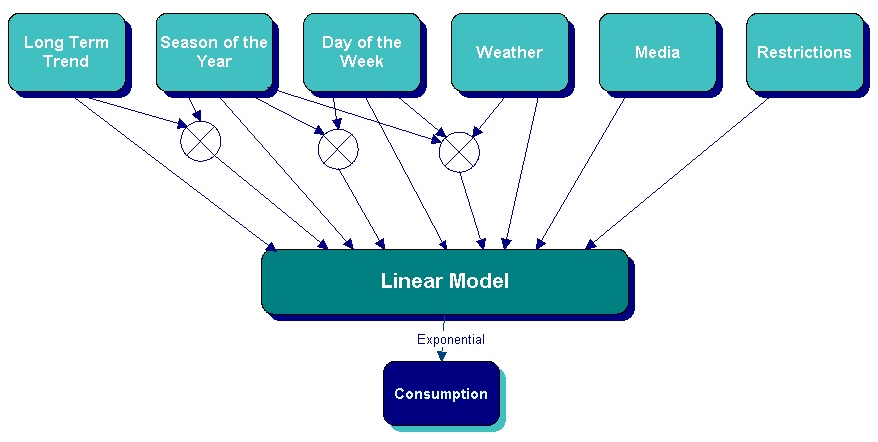
Data Analysis Australia developed a regression model for water consumption using:
- Fourier series to model the annual cycle;
- Data including maximum and minimum temperatures and rainfall to represent the weather effect; and
- Media spending to represent advertising effort.
The actual model was significantly more complicated than this, since it needed to account for the particular random distribution of water consumption and the highly non-linear effect of weather. A simplistic version of this model is given below.
The Result
The result was a direct estimate of the effect of the advertising campaign - the percentage reduction in water demand for every $100,000 spent on advertising. This type of result is exactly what is needed to assist with strategic decisions regarding advertising.
The statistical models also gave a useful byproduct - the ability to adjust water consumption data for the actual weather or any other part of the model. This means that researchers can then better understand other factors that may influence consumption.