
Microsimulation
Overview
The Problem
How do we estimate the number of households with at least one healthcare card for each Australian Bureau of Statistics (ABS) Census collection district?
For this analysis the term “healthcare card” refers to, all Veterans’ Affairs cards, the Commonwealth Seniors Healthcare card and the Healthcare card.
The Data Analysis Australia Approach
To use microsimulation (or small area estimation) to estimate households with at least one healthcare card using information available from the ABS 2006 Census and from the Household Income and Labour Dynamics Australia (HILDA) survey.
The Result
An estimate of the number of households with at least one healthcare card for each collection district in metropolitan Perth. These estimates provided added information that could assist with the determination of possible rebates for this group of households.
The Problem
Providing an understanding of the ability of an area in the Perth metropolitan area to contribute to the Underground Power Program. The problem is to find a method of estimating the total number of households in an area with at least one healthcare card and the distribution of the cards across that area. There is no publicly available source of information on the holders of these cards at the small scale geographic levels required, such as suburbs, and no information on ‘at least one per household’.
How could we estimate the distribution of the number of households with at least one of the eligible cards?
The Data Analysis Australia Approach
The Household Income and Labour Dynamics Australia (HILDA) survey project is Australia’s longest running longitudinal survey which began in 2001 with 7,682 households and now surveys over 10,000 households each year. Some waves of the survey ask about a range of healthcare cards. From Data Analysis Australia’s involvement with the HILDA Technical Reference Group we know that the survey also asks questions relating to demographics and socio-economics and records the responses in a manner compatible with the ABS definitions. Furthermore the survey records the state of residence of the respondents.
Conversely, the smallest geographic area released by the ABS with detailed information, in the 2006 Australian Bureau of Statistic’s Census of Population and Housing (Census) data was for the collection district, collections of approximately 250 households. Data Analysis Australia used the demographic and socio-economic information based on the 2006 Census, at the collection district level, to weight each household in the HILDA survey in terms of how well it represented the collection district.
Weighting can be done in a number of ways and in this context we used small area estimation (also known as microsimulation) to estimate the number of healthcare cards in each collection district. “Healthcare cards” include all Veterans’ Affairs cards (gold, white and orange), the Commonwealth Seniors Healthcare card and the Healthcare card.
Microsimulation models are often used to investigate the impacts on social equity of fiscal and demographic changes (and their interactions). Data Analysis Australia used this method to take information collected from both the households in Western Australia that are part of the HILDA survey and census data for each collection district in Metropolitan Perth. The method systematically determines which households in HILDA represent each collection district in terms of a number of demographic variables which are available in both data sets by estimating a weight for each household in HILDA. The weights are then applied to the information collected on healthcare cards in HILDA giving an estimate of the number of households with at least one healthcare card for each collection district.
The Result
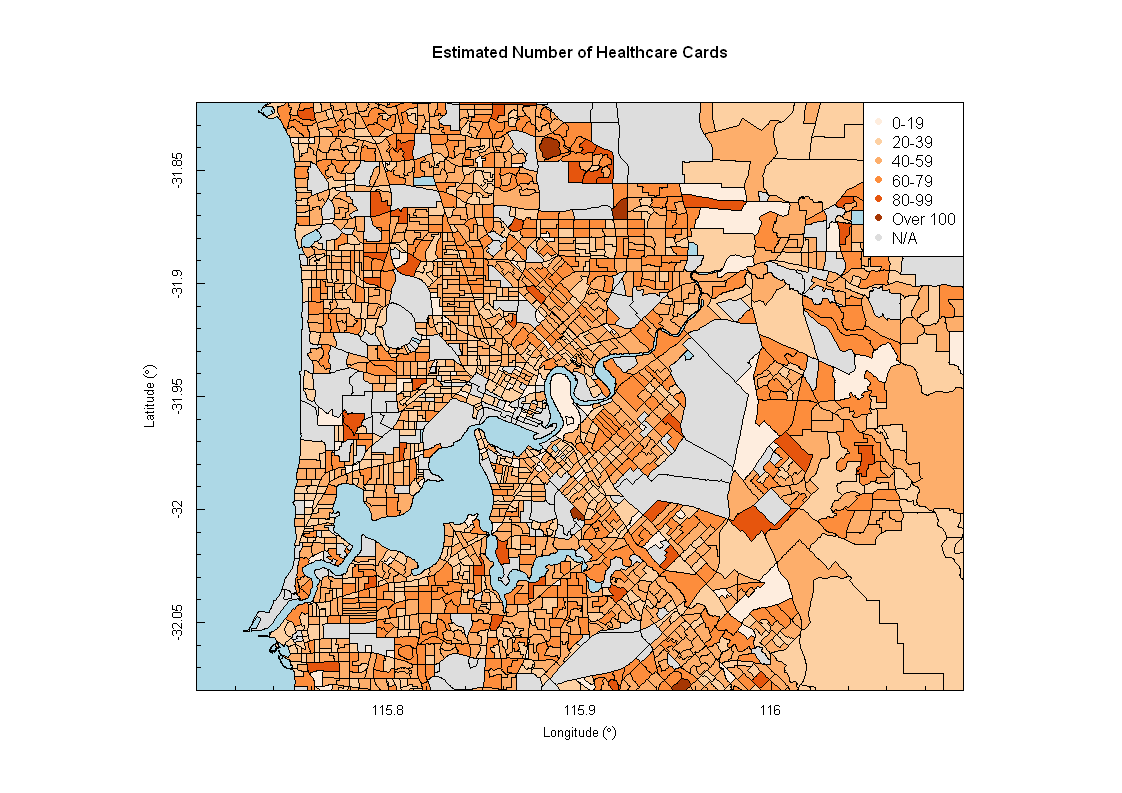
Data Analysis Australia estimated the number of households with at least one healthcare card for every census collection district in the Perth metropolitan area.
The results were verified by mapping them using the statistical software R and the package PBSMapping, and carrying out a check for reasonableness. A visualisation of the results can be seen below with collection districts marked in darker shades highlighting areas with higher proportions of households with at least one card holder.
September 2012