
Perth and Regions Travel Survey
Overview
The Problem:
Transport planning requires comprehensive data on who moves where, why they do it and how. Since daily travel is complex - people travel together in some cases, using multiple modes of transport and may stop at numerous locations on a trip - surveys to collect this information are similarly complex. A key challenge is to collect data representative of a whole geographical region, all times of day and all seasons of the year. Doing this efficiently while maintaining statistical standards in a large survey - more than 10,000 households across the wider Perth metropolitan region over four years - increases the challenge.
The Data Analysis Australia Approach:
To maintain strict sampling quality, Data Analysis Australia used modern geographical information system techniques to optimise geographical coverage within cost constraints, together with personal delivery and pick-up of survey packs to update the sampling frame with information live from the field, answer respondent queries and encourage response. To maintain data quality Data Analysis Australia custom built computer applications that automated many data entry functions and incorporated intelligent checking.
The Result:
A high quality and geographically balanced dataset representing all day-to-day travel and activities from 10,947 households in the wider Perth metropolitan region from October 2002 to September 2006.
The Problem

The Perth And Regions Travel Survey (PARTS) was a four-year study of day-to-day travel patterns of residents in the wider Perth Metropolitan Area. PARTS was conducted by Data Analysis Australia on behalf of the Department for Planning and Infrastructure and Main Roads WA. The survey has implications far beyond transport planning – the depth of information collected can be used for strategic planning in land use, public and private transport networks and locational planning of facilities and services for industries such as health, justice and recreation.
A major challenge in the design of the study was how to effectively and efficiently collect geographically representative and high quality data from households across the wider Perth metropolitan region over four years.
The Data Analysis Australia Approach
We saw this problem as a set of smaller hurdles:
- Compiling a list of all residential addresses or households in the study area from which to draw the sample.
- Testing the procedures and quality of the address list through a pilot survey.
- Designing a sampling regime that ensured geographic coverage across the study area over the four-year study period.
- Optimising data quality through intensive follow-up of respondents and a comprehensive series of manual and automated logic checks throughout data entry and processing.
Compiling a List of Addresses
PARTS was required to collect information from a representative sample of households from the Perth Metropolitan Region and the Shires of Mandurah and Murray. If an exhaustive list of all households within the region had existed, it would have been a simple process to select such a sample. However, although it may not often be realised, there are no such lists publicly available. As a result, there were three options:
- Select the sample in a way that did not make use of a list;
- Select the sample from a partially incomplete list (and accept the biases that arose from this); or
- Develop a sampling list.
Data Analysis Australia chose the last of these options. Our approach was to create a sampling list that was initially too large (by including both residential and non-residential records) and then make this into an accurate sample with the right operational procedures. This approach was made possible because whilst complete lists of households do not exist, complete lists of all land parcels do – the issue is just that they do not accurately identify every individual land parcel as being residential or non-residential. The key to this approach was that instead of retaining only land parcels specifically identified as residential, we retained additional land parcels that were potentially residential and only removed them if they were proven to be non-residential at a later stage.
Our initial list came from the Western Australian Property Street Address (PSA) file, a government database of all land holdings. As the land title system used in Western Australia ensures that this database is absolutely complete in its coverage, and every household must be on some piece of land, it follows that all residential parcels are included on the list, along with all non-residential parcels. This database was then augmented with information from the Water Corporation's Land Use Codes file, to identify land parcels as residential or not wherever possible, and Australian Bureau of Statistics' 2001 Census of Population and Housing data of occupied private dwellings.
This approach minimised wasted effort associated with attempting to sample non-residential addresses, as land parcels that were indisputably non-residential (such as parks and shopping centres) were excluded from the sampling list.
The data augmentation was also used to identify where there were multiple dwellings on a single land parcel. Extra records were added, where necessary, so that each dwelling on a single land parcel had a unique record. For example, if the original PSA file contained only a single record for a land parcel that was identified by the Land Use Codes as containing a block of twenty flats, an additional nineteen records would have been added. This process helped to ensure that flats, units and apartments were not under-sampled, which can be a problem in household surveys.
Pilot Study
The pilot study before the main survey highlighted that a mailout/mailback survey would not produce acceptably high quality results. Response rates were lower than anticipated, and the incompleteness of some addresses in the sampling frame made it difficult or even impossible for Australia Post to correctly and consistently deliver the questionnaire packs and reminder letters. The PSA file was simply not accurate enough for a mailout, since the detail required for legally defining land (which does not use street addresses) differs from that required for correct delivery of mail. However Data Analysis Australia saw the need to still use the file since it was the only sampling frame that could provide 100% coverage.
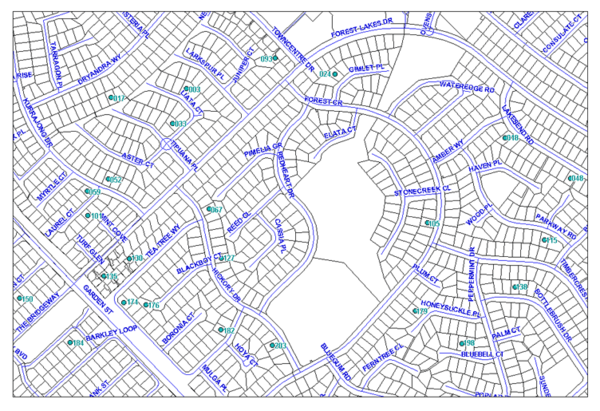
The solution was to change the method of using the addresses. A personal delivery/collection methodology was chosen using our own fieldwork staff with rigorous rules for dealing with incomplete or incorrect addresses. Whilst a majority of households could be readily identified from the information available in the PSA file, a key aspect of the personal delivery was that fieldworkers could be given more information to help them correctly “find” the intended address for more difficult to find addresses, such as households on corner blocks that could have an address using either street name. In particular, maps based upon land boundary data were created for each fieldworker, highlighting the dwellings to be sampled, so that even if the address itself didn't exist, the intended block of land could still be identified. These maps to guide staff were critical in overcoming problems due to imperfect or erroneous street addresses, ensuring reliability of sampling.
This revised delivery methodology was itself piloted and the decision made to continue with the personal delivery and collection for the main survey.
Designing a Sampling Regime
With a mailout survey there are no cost constraints in terms of geographical dispersion of the sample and the same postage costs apply whether each mailout is targeted to a particular area or whether the mailout is spread over the whole region. Therefore the optimal sampling strategy is to spread the weekly sample over the entire region. However, the travel time and costs associated with personal delivery and collection make this infeasible. Instead, it required a sophisticated sampling strategy to keep costs under control whilst maintaining a geographic balance at all times.
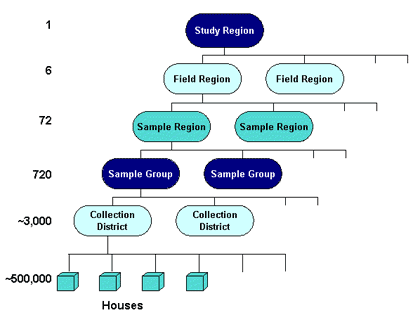
Data Analysis Australia developed a hierarchy of zones that ultimately divided the Perth region into 720 workable fieldwork areas, termed Sampling Groups. The entire study region was first separated into six Field Regions recognising natural boundaries such as the Swan River and the freeways. Each Field Region was then separated into 12 Sample Regions, each of which were further separated into 10 regions, forming the 720 Sampling Groups. This process generated sampling groups of a size that was reasonably cost effective whilst maintaining good levels of sampling efficiency. Over the four years, each Sampling Group was sampled at least once, so that every household in Perth had a chance of being selected in the survey.
The order in which the Sampling Groups were sampled was important to ensure that even over relatively short time periods, such as one or two weeks, the sample would be balanced and this was where the hierarchy was used. For example, since travel patterns are strongly influenced by the distance from the centre of Perth, it was critical to balance the sampling to ensure that each week some Sampling Groups were close in and some were further out. The order in which Sampling Groups were selected was defined at the commencement of the survey to ensure the geographical balance on a weekly, monthly and quarterly balance was achieved throughout the lifetime of the survey.
Within each Sampling Group, the selection of households to sample was also controlled. This required a balance between preventing the sample from being too spread out and hence time consuming, and preventing some types of land or houses being more likely to be sampled than others. For example, randomly selecting a geographical point and then choosing the residential block of land closest to that biases the sampling towards houses on large blocks of land or houses surrounded by commercial land. Many techniques exist for sampling from lists, but it is not as straightforward for areas. Data Analysis Australia developed a method that ordered the land parcels in each Sampling Group to a one-dimensional list using a “space filling curve” based on a closed version of the Peano-Hilbert curve. The premise behind this was that dwellings close together and as the crow flies were also likely to be close together on the curve and hence would be close together on the ordered list. Finally this list enabled a selection of dwellings to be sampled.

Fieldwork
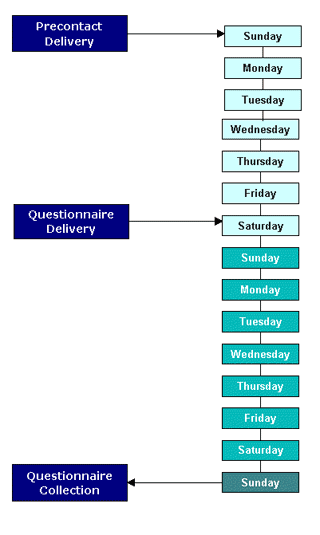
The fieldwork itself was a large undertaking and followed a weekly cycle of pre-contact, questionnaire delivery, questionnaire completion (by the respondent), questionnaire pickup, data entry and processing. Each week up to six sampling groups were surveyed and each selected household was given a nominated day within that week to complete their questionnaire. The weekly cycle involved the following steps:
- During the week, a fieldworker would visit each sampled dwelling to deliver an introductory letter and brochure describing the survey and informing the household that a questionnaire pack would be delivered to them on the following Saturday. At this stage non-residential addresses were noted as such and removed from the sample and incorrect addresses were corrected if possible. Stringent procedures were developed so that addresses were corrected in a consistent manner and the correction process introduced no biases.
- On the Saturday at the commencement of the survey week, fieldworkers would personally deliver the questionnaire packs to the selected households. This face-to-face contact encouraged a high response rate and enabled some queries to the answered at that time.
- During the survey week each household would complete a detailed travel diary for a travel day assigned by Data Analysis Australia. To avoid biases in the results, it was imperative that the forms were filled out for the day that had been nominated for that household, rather than letting each household choose their own travel day. Every household member was asked to complete a travel diary, providing information regarding each leg of travel they completed on that day.
- On the Sunday following the survey week, a fieldworker would personally collect the completed questionnaires. Again, some queries were answered at this stage. Where contact could not be made, households were asked to mail the questionnaires back.
- The office team would then check the questionnaires and data enter all responses. Where possible omissions and errors in the response were resolved through telephone contact. The telephone follow up was a crucial aspect of our quality control procedures. In all, over 80% of households received telephone follow up, although for many of these households the phone calls were simply a case of confirming that all of the provided information was correct and that no travel had been missed, rather than needing to make any corrections.
- Another major aspect of the survey was collecting information on the inter-relationships between the travel of different household members and, in particular, any travel that household members undertook together. Since all members of the household recorded their travel, which included recording any other members of the household that they travelled with, it was possible to validate these trips by cross checking that the reported travel was consistent between all household members. Simple but informative graphical displays of each household member's travel were designed to assist this process. Where necessary, households were followed up to resolve any inconsistencies.
Further quality control checks were carried out at a number of times between data entry and preparation of the final data set. A major component of the quality assurance process was the development of a series of checks aimed at identifying any potential errors or inconsistencies in the data. Every record was run through this set of checks multiple times and any record which was identified as potentially erroneous was individually examined and resolved.
Quality Control
The data collected was complex, recording exactly where, why, when and how each member of the household travelled during their day. So no ordinary data entry system was used. Instead, Data Analysis Australia developed a custom system with a key feature being the incorporation of numerous data quality checks that could either be resolved at the time (in terms of data entry errors) or would highlight areas where telephone follow up with the respondent was required.
Being a travel survey, a major focus was accurately recording where people travelled. Respondents provided this information by giving the address or other information, such as a place name, and this information was then coded down to individual land parcels by Data Analysis Australia. This coding had to be both efficient and effective and also flexible enough to deal with different levels of information provided. An innovative algorithm was developed to perform this coding in real time during data entry. The algorithm involved probabilistic matching of the respondent address details against a database of over 600,000 land features in the region. Probabilistic matching was required since people make minor mistakes or provide incomplete address information on their forms. This process of selecting the best match took less than one second so that it did not interrupt data entry, quite an achievement by Data Analysis Australia's computing staff. The real time coding played a large part in contributing to quality control, as it enabled immediate computation of travel times and hence flagging possible respondent errors or missing travel, which could then be followed up with the respondent.
Another major aspect of the survey was collecting information on the inter-relationships between the travel of different household members and, in particular, any travel that household members undertook together. Since all members of the household recorded their travel, which included recording any other members of the household that they travelled with, it was possible to validate these trips by cross checking that the reported travel was consistent between all household members. Simple but informative graphical displays of each household member's travel were designed to assist this process. Where necessary, households were followed up to resolve any inconsistencies.
Further quality control checks were carried out at a number of times between data entry and preparation of the final data set. A major component of the quality assurance process was the development of a series of checks aimed at identifying any potential errors or inconsistencies in the data. Every record was run through this set of checks multiple times and any record which was identified as potentially erroneous was individually examined and resolved.
The Result
A pilot study before the main study demonstrated that a mailout/mailback methodology would not be sufficient to obtain the required response rate and accuracy and also it would introduce biases due to issues with the sampling frame. As a result, the processes were altered to a personal delivery/pickup methodology. This enabled us to select an unbiased sample, as dwellings with an incomplete or incorrect address in the sample frame could be retained via fieldwork staff following a set of stringent rules to find and correct such addresses. A further benefit of establishing personal contact with the households was that fieldworkers could encourage householders to respond to the survey and were on hand to answer any queries about the survey, leading to an increased response rate and higher data quality.
The sophisticated sampling strategy gave a geographically balanced dataset throughout the four years that the survey ran. The high quality of the sampling was verified by a low level of variation in the final survey weights, showing that representativeness had largely been achieved. This greatly improved the statistical efficiency of the survey.
The stringent quality control procedures in place throughout the survey resulted in a final dataset of extremely high quality, in terms of both accuracy and completeness. The dataset is rich in content, with responses from 10,947 households representing all day-to-day travel and activities of households in the wider Perth metropolitan region from October 2002 to September 2006.
For researchers interested in using results from the survey, please contact the Department of Planning or the Department of Transport (formerly integrated as the Department for Planning and Infrastructure).
May 2007