
Significance of Rare Cases in Large Data Sets
Overview
The Problem:
- To determine whether there is a change, either in trend or the current year differing from previous years in infection rate data. The challenge is in the data sets where there are a large number of cases but a small number of positive readings.
The Data Analysis Australia Approach:
- To review the existing methodology with a focus on ensuring the correct implementation and interpretation of the statistical models based on the subtleties of the data structure. Make recommendations and develop a methodology that was not only statistically sound but was objective, systematic and flexible.
The Result:
- The development of a decision tree scenario so that for each data set the most appropriate method of analysis could be applied based on the individual characteristics of the particular dataset. This provided a systematic approach that was well documented and repeatable to ensure a quick turnaround of results to the client.
The Problem
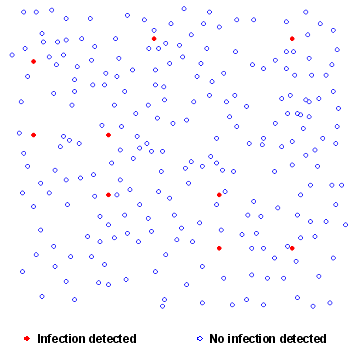
The data collected came from many countries in the Australasian region, and as far away as Germany and the USA. The detection of changes or trends in prevailing infection rates in collection regions is of critical importance. This may sound straight forward however the nature of the data where there exists large numbers of cases and very few positive infection rates makes for some interesting modelling and analysis. Data Analysis Australia was asked to review current practices and provide a methodology for analysing the data.
Datasets for each country to be analysed, consisted of a large number of independent cases, each of which could record one of two outcomes - in this case a positive or negative result. The number of positives was very low relative to the number of cases. The data analysis had to be statistically sound, demonstrate best practice and follow a well-documented, repeatable process, allowing external review by regulatory bodies.
The Data Analysis Australia Approach
Statisticians have an in-depth understanding of the properties of different data structures and have developed a suite of tools, enabling effective and powerful analyses to be undertaken when the correct tool is applied. When the results of the analysis are this important, a comprehensive understanding of what each model is doing, what assumptions it uses and how well the model fits the subtleties of each dataset cannot be underestimated. Understanding the properties of the underlying data is key to selecting the correct method of analysis and this is one of Data Analysis Australia's strengths.
Datasets of this nature, where the outcome can be only one of two values, would naturally be expected to follow the binomial distribution, the properties of which a statistician understands well, and hence, models specifically based on this distribution were the natural starting point. In some cases, a different distribution - the Poisson distribution - can be used as an approximation to the binomial distribution. This approximation is often used for computational convenience, however this was not an issue for this analysis and hence there was no reason to choose the approximation over the exact distribution.
The general idea behind a binomial model is to model the probability of the outcome being positive based on potential factors that could influence this probability. The year of collection and an indicator for the current year were included in the models for this analysis to determine whether there has been a change in infection rates over time or whether the infection rates this year are "different" to previous years. Well understood ideas of "statistical significance" are used to determine which model terms should be retained in the model.
A model is considered to fit a dataset well when there is little difference between the predicted and actual values. A large difference is an indication of a poor model fit. Collecting more data, or including further terms in the model should then be considered and tested to see if these improve the model fit. For example, incorporating an extra term in the binomial model to differentiate between the different collection centres in a dataset has helped explain the variation between cases and improved the model fit in some datasets.
Sometimes, however, it is simply that the data itself displays greater variability than would be expected given the underlying distribution, a situation usually termed overdispersion. Overdispersion can lead to an understatement of the standard errors associated with the model estimates, which in turn can lead to erroneous conclusions being made about the effect of some variables.
A quasi-Binomial model can be used when overdispersion is present. This model is similar to the Binomial model, but with standard errors of the model estimates adjusted to take overdispersion into account. Data Analysis Australia uses model deviances (standard statistical outputs from models of this type) to determine whether overdispersion exists and hence whether a quasi-Binomial model is needed or whether the exact Binomial model can be implemented for each dataset to be analysed.
The Result
Data Analysis Australia recognised that while the underlying data structure was common to each dataset, individual characteristics varied. A decision tree was created so that the most appropriate model could be chosen for each dataset submitted by the client for analysis. This systematic approach provided a quick turnaround from the receipt of data to reporting of the results. When dealing with safety issues such as disease control, timeliness of response is critical.
February 2010