
Solar Power and Storage
Overview
The Problem:
- Horizon Power, the Government-owned electricity provider for Western Australia’s regional and remote areas, wanted to investigate the effect of large numbers of customers installing solar panels and batteries.
The Data Analysis Australia Approach:
- To develop a simulator to test multiple assumptions regarding battery usage, in conjunction with multiple combinations of solar panel and battery sizes and providing graphical displays of outputs to enable the results of thousands of simulations to be quickly and easily compared.
The Result:
- By identifying the lowest cost options for customers, Horizon Power gained an understanding of possible long term changes in their customers’ power needs, enabling them to better plan for the future.
The Problem
There has been a rapid increase in the installation of household solar panels in Western Australia over the last few years, and this is expected to continue. In addition, it is expected that the price of large batteries capable of storing the excess electricity generated by solar panels will drop, making them affordable for many home owners. If battery installations increase at a similar rate to solar power, many customers may soon be able to supply their own electricity after dark, not just during the day. Horizon Power has already seen how solar panels have changed electricity demand, but needed to understand the likely effect of customers also installing batteries on a large scale.
The Data Analysis Australia Approach

Data Analysis Australia developed a bespoke simulation processor that incorporated models for the amount of useable electricity generated by solar panels, the likely usage of a storage battery and the total amount of electricity needed by a customer. By running simulations, we were able to easily change not only the input values, such as the size of solar panels and batteries, but also the assumptions behind the models and hence could investigate numerous different scenarios.
Modelling the electricity generated by solar panels was, by itself, relatively straightforward and involved calculations of the angle between the solar panels and the incoming sunlight. Simulations involving the time of day, season and panel angle enabled us to calculate electricity generation for an entire year for several locations around Western Australia.
A much more sophisticated model was required for the operation of a battery. As few customers currently have batteries attached to their solar panels, there is little information about how customers may use such batteries and the model needed to be flexible enough to incorporate different assumptions regarding when the customer would charge the battery and when they would discharge the battery.
Our approach enabled us to test options around these behaviours. For example, a consumer may prefer to charge the battery when the solar panels are generating more electricity than can be consumed in order to take advantage of particularly sunny days or a period of low electricity use. Other consumers may use the battery as soon as they need more electricity than is generated by the solar panels on days with little sunlight or during periods of high electricity use. Still others may adopt a more measured approach of always charging the battery at certain times of day or of only using it at specific times of the day.
The model also included physical constraints on the use of batteries, including maximum charging and discharging rates. As the charge a battery contains in any given hour is dependent on the charge it contained in the previous hour and also what happened in that hour, a simulation approach is ideal and allows the battery’s state to be determined sequentially from hour to hour.
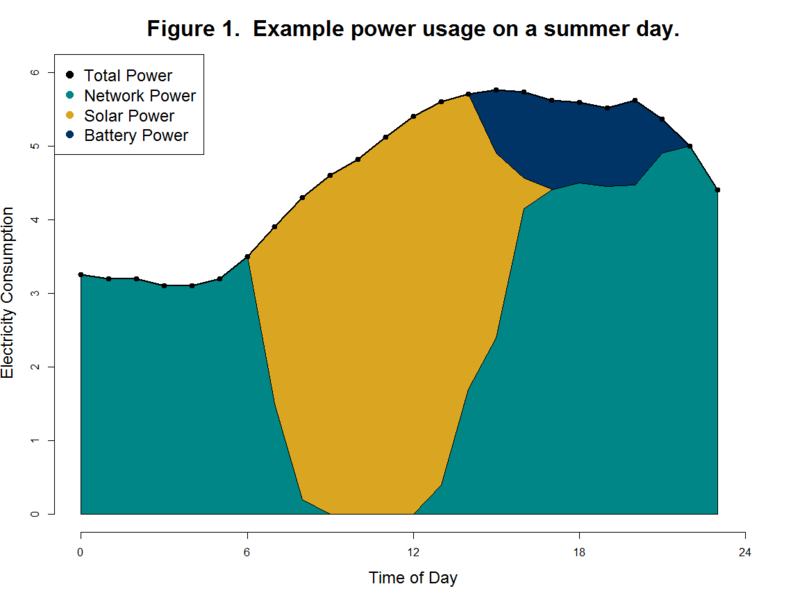
Graphical displays of the outputs of the simulator were provided, from which an understanding of the interactions between the various model assumptions could be developed. This enabled an iterative process of refining model assumptions to ensure sensible final results. Figure 1 shows an example customer’s power use on a typical summer’s day, based on one of the scenarios investigated. It shows solar power can meet most of the customer’s needs during daylight hours, with battery power used in the early evening to reduce the customer’s reliance on the network.
Data Analysis Australia automated the simulation process to enable tens of thousands of different scenarios to be run through the model to investigate the effect of combining solar panels and batteries of various sizes. As each simulation was run with a full year’s data, the implementation required the use of efficient algorithms and parallel computing to reduce the computation time as much as possible.
Costs to the consumer were calculated as each scenario was modelled. This was another way of ensuring only reasonable scenarios were considered in projections of likely customer behaviour. Each scenario considered the cost of purchasing and maintaining solar panels and batteries plus the cost of additional electricity provided through the electricity network.
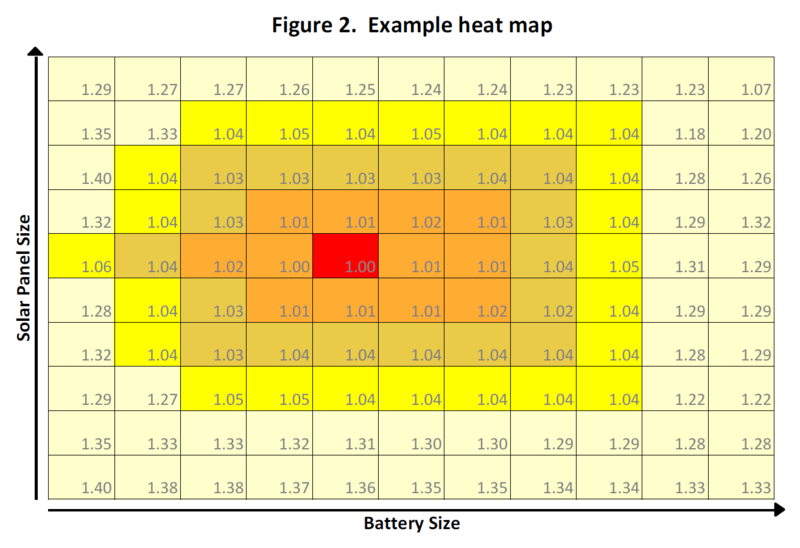
While the optimal combination could be determined as simply the lowest cost combination, the costs for individual customers will vary and hence we wouldn’t expect all customers to choose the same combination. Therefore it was important to identify a range of combinations that customers might choose, to understand the overall effect. This was done by displaying the costs for multiple scenarios as a heat map, similar to that shown in Figure 2. The lowest cost combination is shown in red, and is surrounded by an area of relatively low cost combinations, which are shown in orange to dark yellow. Finally, the pale yellow regions show combinations that are much higher in cost. Based on where the costs rise dramatically, we could determine the range of realistic combinations on which to focus for further analysis, reducing the task from looking into tens of thousands of options to perhaps ten options.
The Result
We were able to provide Horizon Power with valuable insights into the effect of customers installing a combination of solar panels and batteries. The identification of a range of cost effective combinations of solar panels and batteries provided an understanding of the variation in what individual customers may do in the long term, which helped to identify a set of likely outcomes for the whole network.
This then enabled Horizon Power to focus on a much smaller subset of combinations involving best and worst case scenarios. Such information is key to the development of long term risk management strategies to ensure Horizon Power continues to be able to meet the needs of their customers.
NB. Figures 1 and 2 are for illustration purposes only and do not contain actual results.
June 2015