
Spatial Sampling
Overview
The Problem:
- The accuracy of Western Power’s database of approximately 80,000 wooden electricity poles, identified for pole replacement and reinforcement, needed to be assessed as part of the assurance at completion of the programme.
The Data Analysis Australia Approach:
- A sample of poles was selected for physical inspection, taking into account available resources of inspection staff and time available. A compromise was required between time spent travelling and time available for inspecting the selected poles, while achieving a reasonable number of poles sampled from as large and varied an area as possible.
- Objectivity was ensured by strict random sampling in two stages, forming random clusters for each half-day per inspection team.
- Geographical coordinates and maps in various forms were central throughout this project.
The Result:
- The sampling scheme that Data Analysis Australia developed was statistically sound as well as practical and achievable within the available resources. The inspections were completed successfully, and EnergySafety relied on the results.
The Problem
Western Power, the network operator responsible for electricity supply in most of south western WA, needed to replace or reinforce many of its rural wooden electricity poles which were near the end of their serviceable life. EnergySafety, an industry-funded WA government division in the Department of Commerce, is Western Australia’s electrical safety regulator monitoring that programme of up-grading.
EnergySafety contracted Data Analysis Australia to design a sampling scheme to check the veracity of Western Power’s pole database records by physically inspecting a sample of wooden poles. The aim was to determine that the records accurately reflected what was “on the ground”, not to detect unsafe poles.
The Data Analysis Australia Approach
The use of maps was an important adjunct to the usual statistical principles of sampling and consideration of practicalities, due to the spatial element of the sampling exercise.
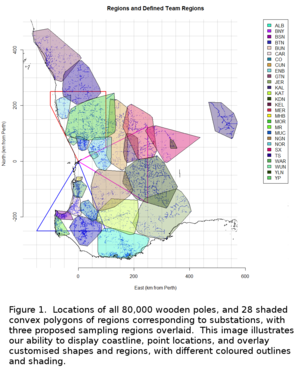
Data Analysis Australia first produced a map of locations of the approximately 80,000 wooden poles. These poles belonged to 28 regions associated with different substations. To highlight the spatial distribution of the substation regions, we developed an algorithm to define a convex hull enclosing each substation region, and overlaid these on the map as 28 coloured polygons. We used these to assist with defining three sampling regions, which are also overlaid on the resultant map (Figure 1) as three outlines emanating from Perth.
To get a good representation of poles in the sample, it is desirable to select from poles with a range of characteristics. These included substation region as well as environmental conditions and distance from Perth. However this had to be tempered with feasible driving distances for the inspection teams in the time available – three teams for one week each. The latter consideration limited the extent of the inspection regions.
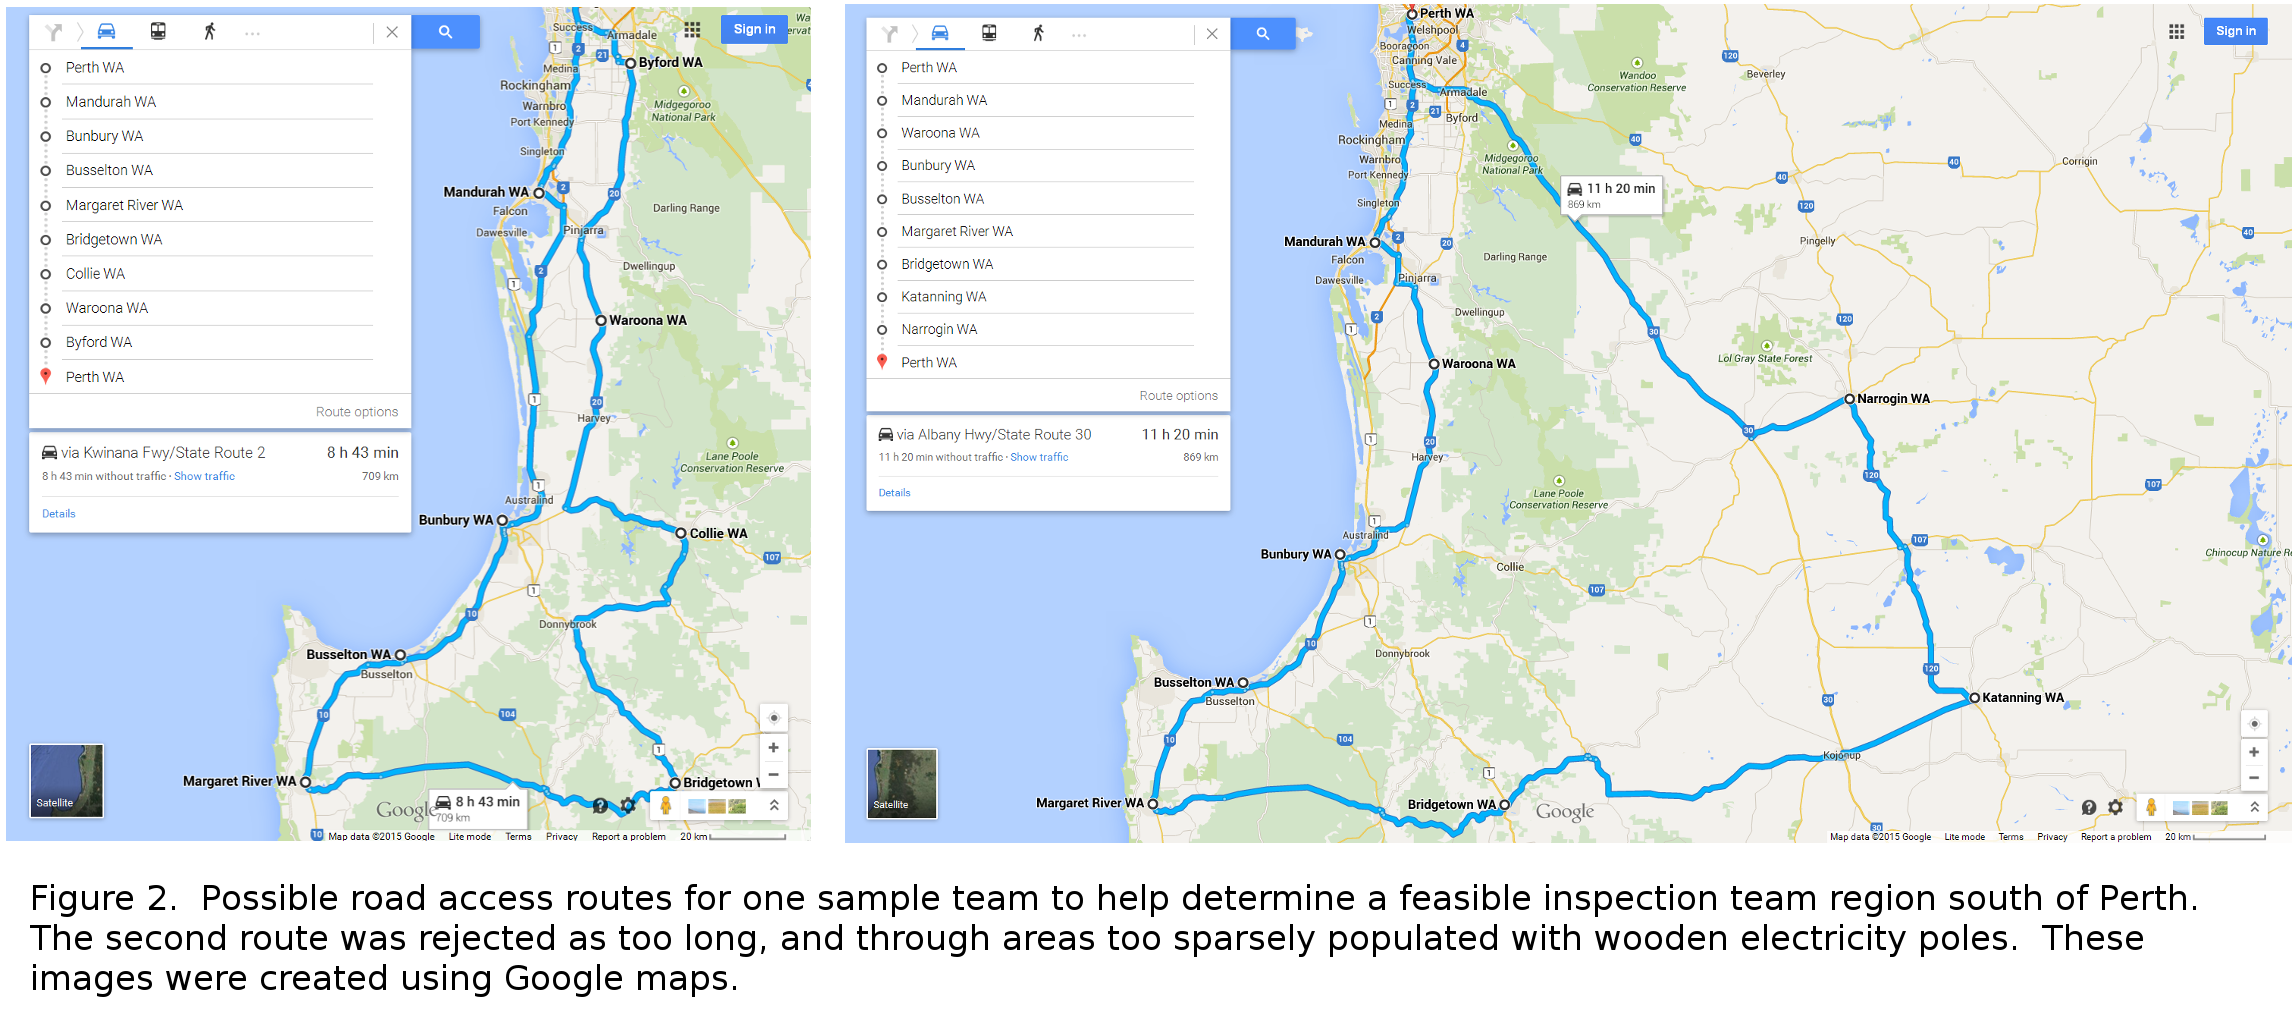
The three sampling regions outlined on Figure 1 were chosen in conjunction with consideration of roads and potential driving routes and times, utilising the functionality of Google maps, as shown on Figure 2 for the southern sampling region. The three regions are a good compromise between time spent driving and extent of the area that can be sampled, excluding poles impractically far from Perth.
In discussion with EnergySafety, it was decided that 20 poles was a feasible number for each team to inspect in a half-day, with these poles located in loose clusters to avoid excessive travel time.
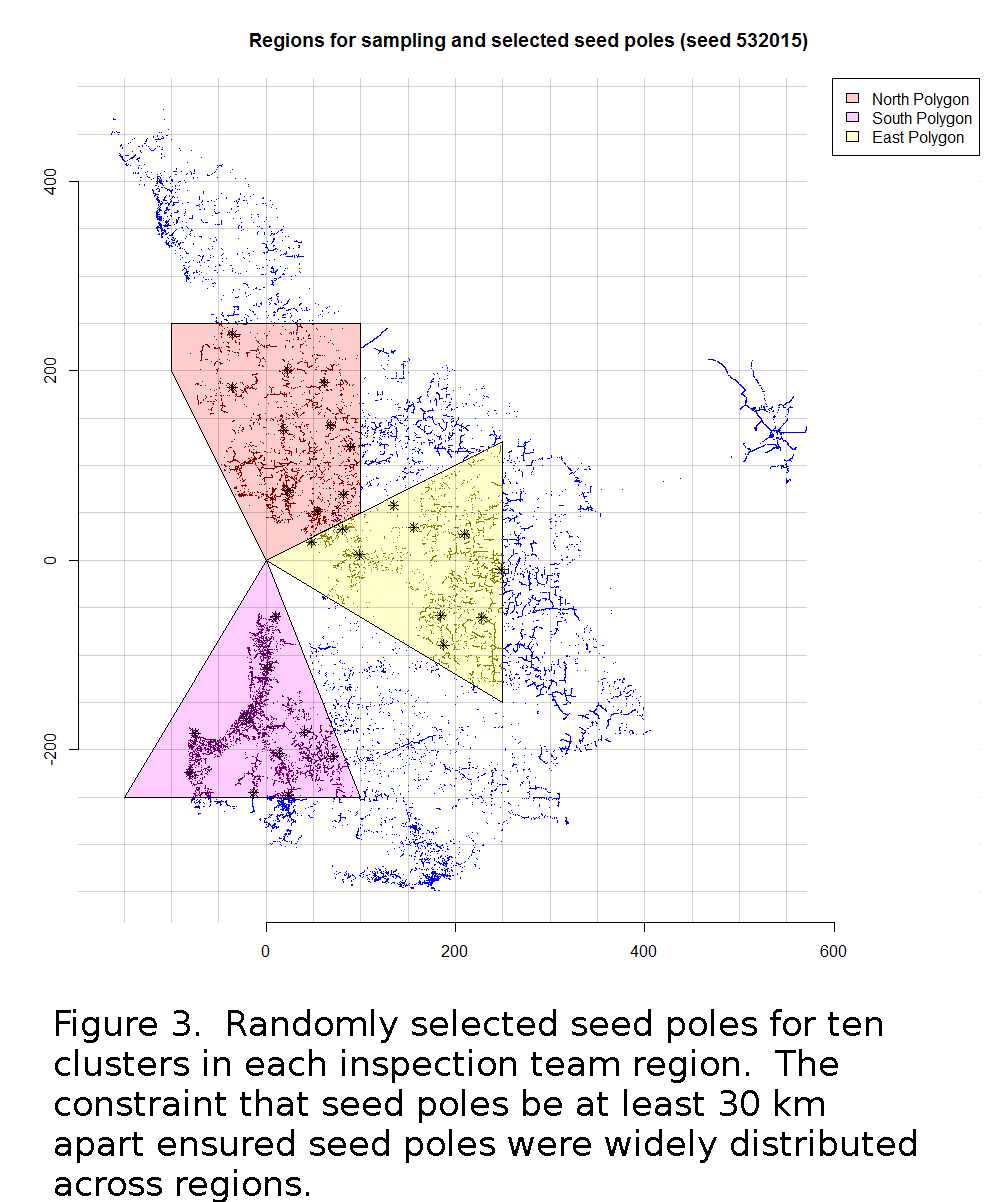
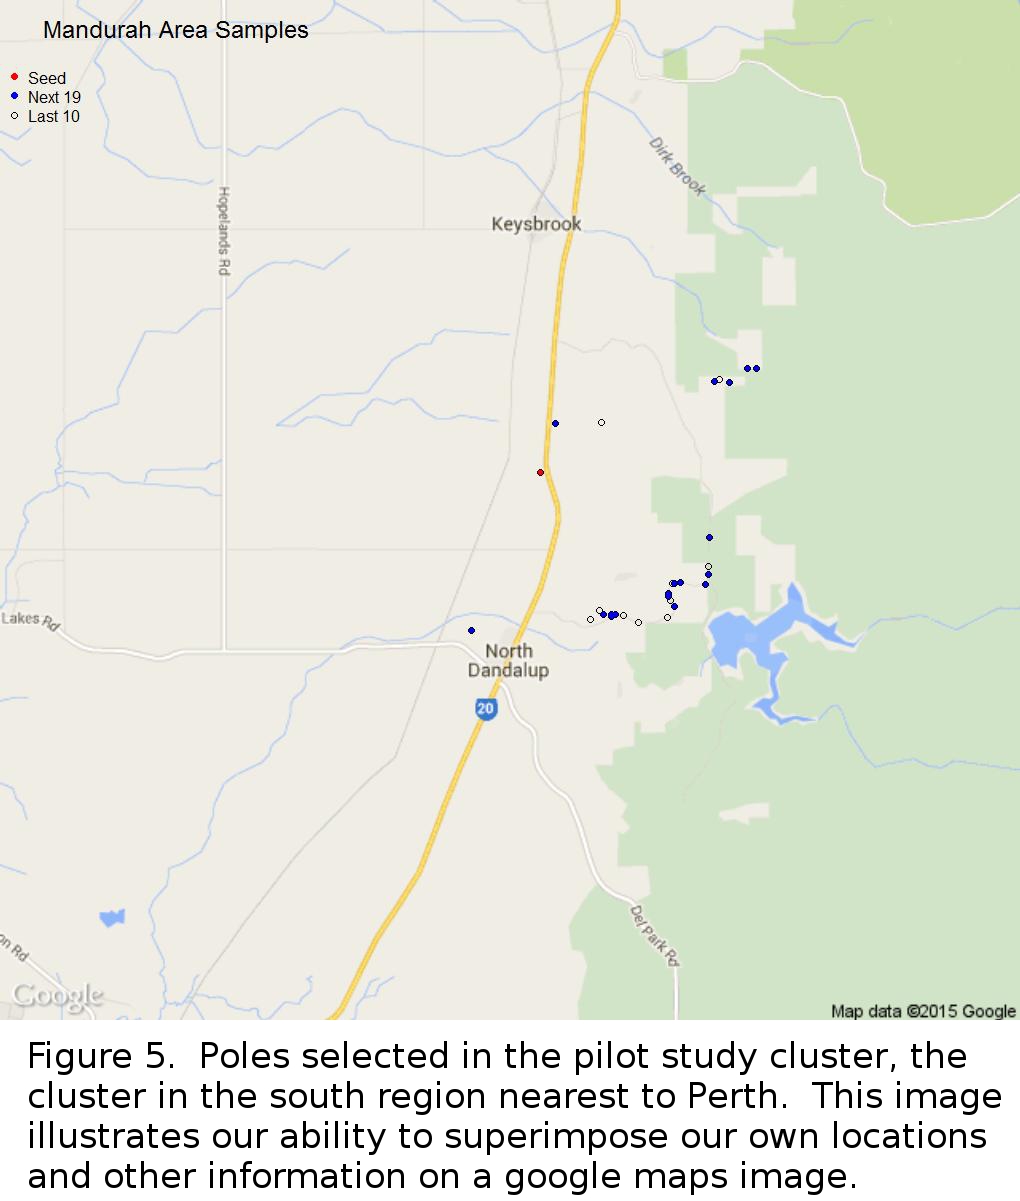
To ensure objective sample selection, poles were selected randomly, using a formal pseudo-random number generator. The half-day clusters were chosen by first randomly choosing ten “seed poles”, one for each half-day, within each team region (Figure 3), with the constraint that seed poles be at least 30 km apart as the crow flies. This ensured that clusters would be from across a wide area.
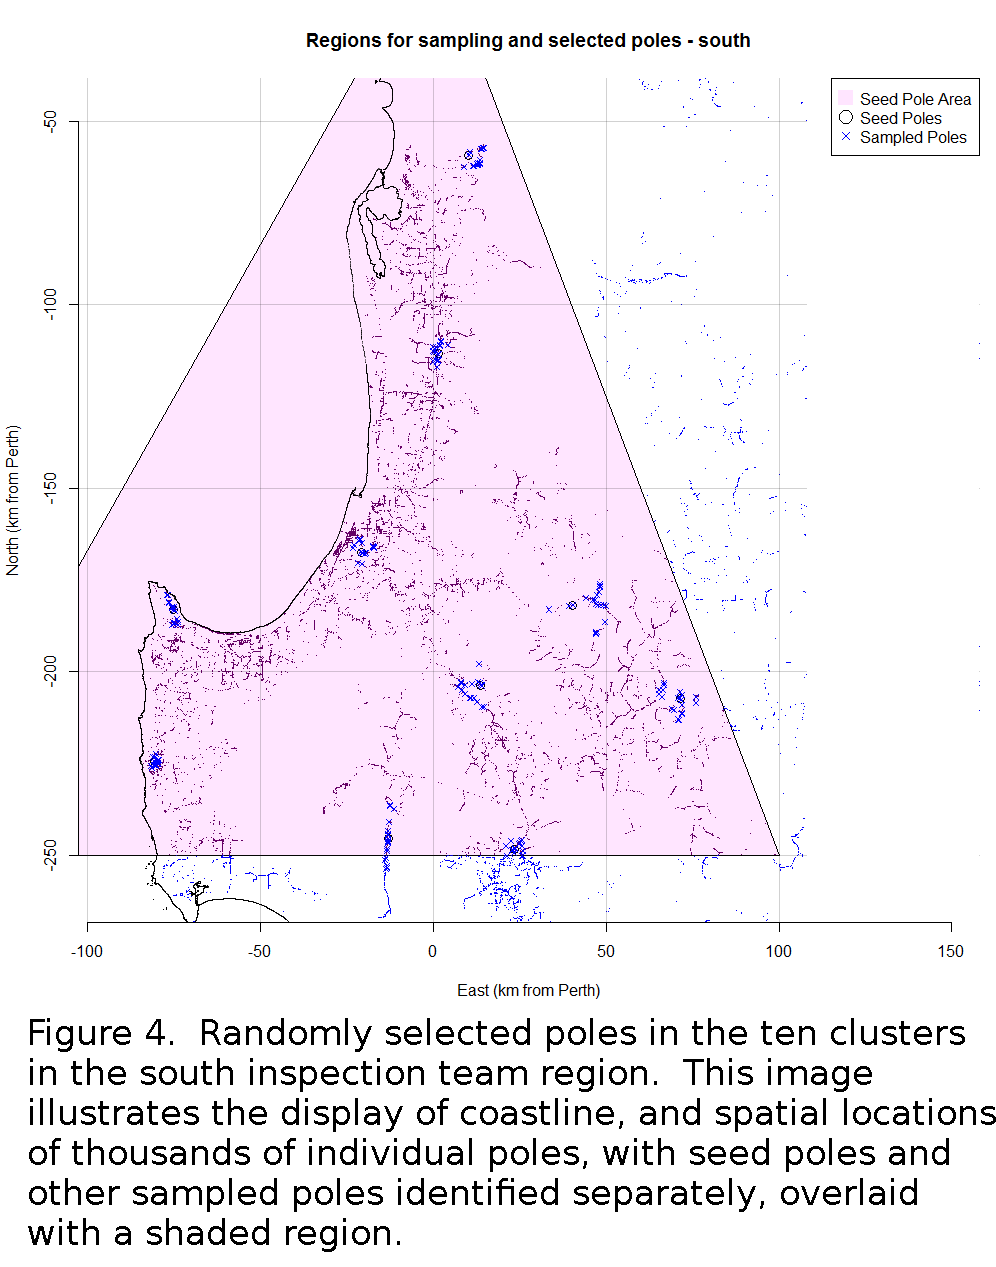
For each cluster, 19 of the nearest 100 wooden poles were selected, completely at random, providing a practical compromise between distributed clusters but within feasible distances for inspection. Figure 4 shows the ten clusters of 20 poles randomly selected for the southern inspection region
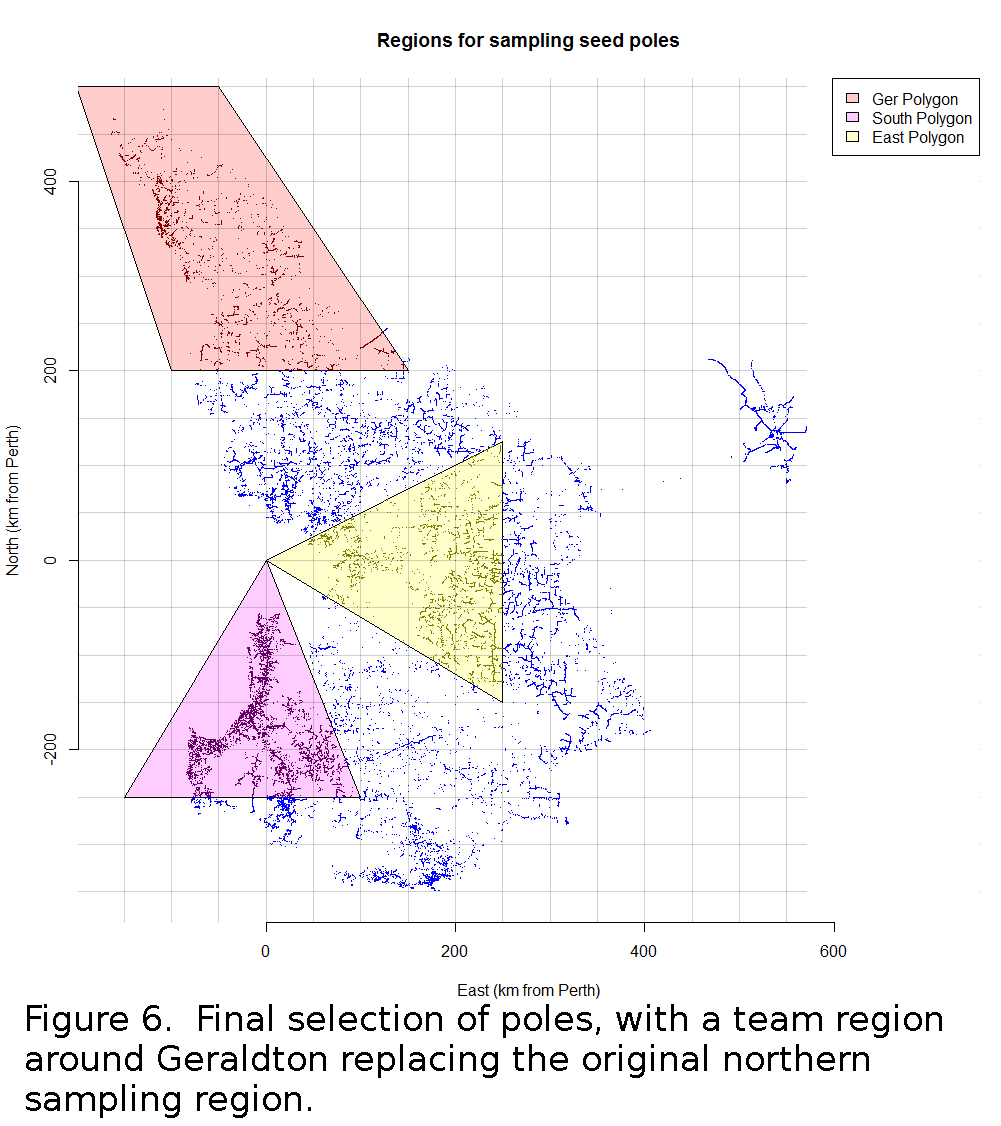
A pilot study of one of these clusters (Figure 5) was carried out to ensure practicability of the travel distances and number of poles to be inspected, before the full survey design was finalised. After the initial sample design, an inspection team based in Geraldton, north of Perth, became available. An alternative inspection region was defined for this team and a sample chosen on the same basis, to replace the northern team region. The result is shown in Figure 6.
The Result
Data Analysis Australia developed a statistically sound sampling scheme for EnergySafety and Western Power to inspect an objectively randomly selected sample of wooden poles to assess the accuracy of Western Power’s database records of wooden electricity pole locations, condition and status (e.g. replaced or reinforced).
The sample design incorporated practical constraints on resources and time, including a pilot study to ascertain feasibility. The inspections were carried out successfully, and EnergySafety relied on the results.
June 2017