
Understanding Environmental Impacts – When Less is More
Overview
The Problem:
- Is diamond mining in the headwaters of Smoke and Limestone creeks in the Lake Argyle catchment having an impact on aquatic fauna biodiversity in the downstream environment?
The Data Analysis Australia Approach:
- Compared fish diets between streams using stable isotope mixing models.
- Used multivariate analyses to eliminate non-important variables and to combine data on species, environmental and mining activity.
The Result:
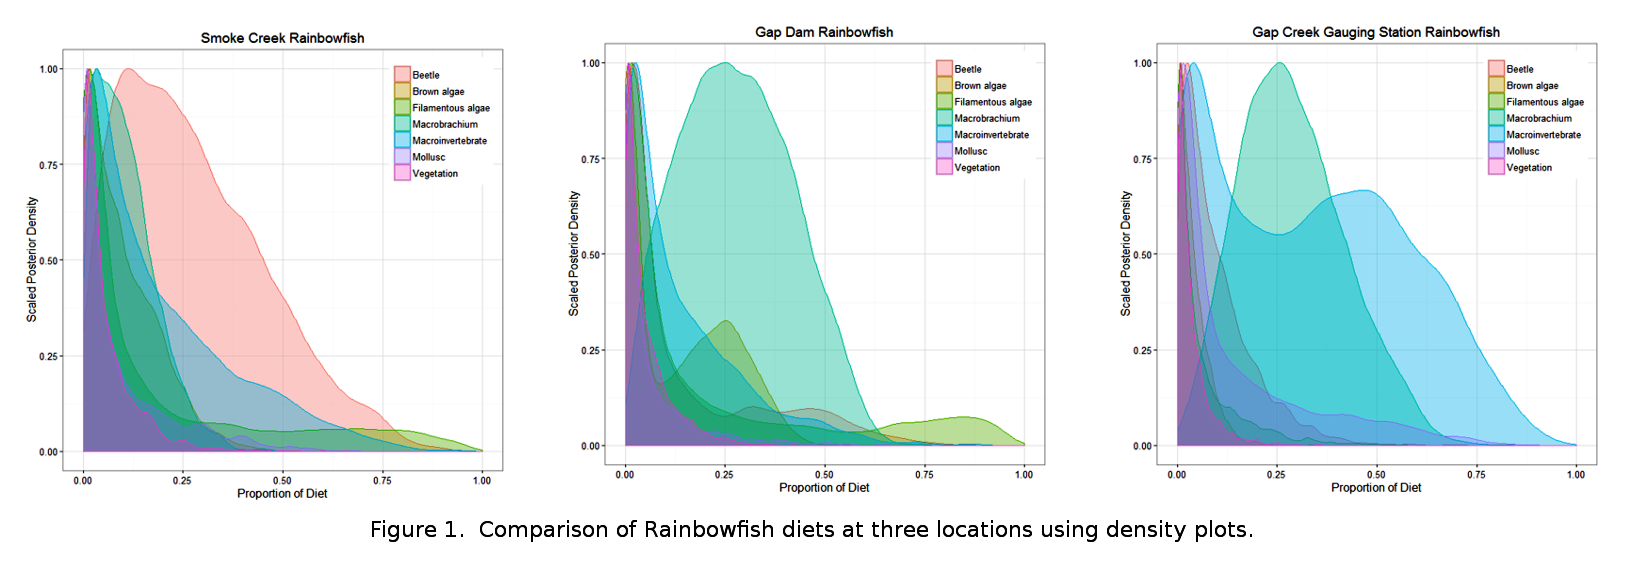
- Fish diets were compared using attractive, easily interpreted density plots
- By using multivariate analyses, the client was able to visualise the effects of diamond mining on freshwater macroinvertebrates and also to identify which water quality factors might be driving those impacts.
The Problem
Effectively managing environmental impacts is a requirement for mining companies to ensure that mining activities do not have an adverse impact on biodiversity, either during mining or after mine closure.
As a by-product of diamond mining in the northeast of Western Australia, water quality is altered and sediment is released into streams downstream of mining activities. Aquatic ecologist, Michelle Rhodes, of 360 Environmental, conducted a study to investigate the impact of increased sediment and magnesium sulphate on freshwater aquatic ecosystems.
The challenge was to select variables that may be important (and exclude non-meaningful data) in the ecosystem and to combine thousands of data points to test for the impact of mining on freshwater stream ecology.
The Data Analysis Australia Approach
Data had been collected on a range of water quality parameters, fish gut contents and aquatic invertebrates collected using hand held nets. The macroinvertebrates were counted and identified to calculate abundance and diversity for freshwater streams with mining and without (control) mining run-off.
Fish Diets
Stable Isotope mixing models were used to model how the diets of the fish differed between different freshwater streams. These models use carbon and nitrogen isotopes (chemical signatures) to model the foods they have consumed.
Macroinvertebrate Communities
Cluster diagrams and tables were previously used to compare macroinvertebrate biodiversity data for the mining and control streams. However, tables and clusters can be difficult to interpret, especially when multiple variables are involved.
What was needed was not only a means of selecting important variables, but also a way to visually explore the data and test for significant differences in the invertebrate biodiversity between the mining and control sites.
The solution was to use multivariate analysis to identify variables that should be included in the model and to combine environmental, species and impact data.
Principal components analysis and correlation was used to determine if water quality parameters were interrelated. This facilitated variable selection and eliminated variables that were unlikely to be meaningful in the analysis.
The species dataset was arranged into a data array and Non-metric Multidimensional Scaling was used calculate the similarity (or dissimilarity) between sites on the basis of the abundance and diversity of the species recorded. The selected water quality parameters were then added to the analysis to explore how water quality related to the composition of the macroinvertebrate communities in the mining and control sites.
The Result
Fish diets
The stable isotope analysis demonstrated that the diets of fish differed markedly between the streams of the Argyle River catchment. For example, Rainbow fish diets were dominated by beetles at Smoke Creek, freshwater prawns (Macrobrachium) at Gap Dam and Macroinvertebrates at Gap Creek Gauging Station (Figure 1). The results could not be used to infer a mining impact, because there may be other biological and environmental reasons why fish diets vary between locations. They did, however, raise an important question for further research - why do fish diets show such a high degree of variability in the same catchment area?
Macroinvertebrate Communities
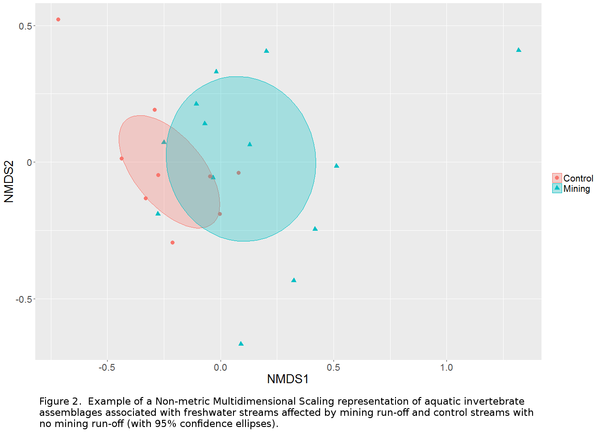
Multidimensional Scaling was coupled with Permutational Multivariate Analysis of Variance Using Distance Matrices (PERMANOVA) to demonstrate that while some species were common to both mining and control sites, there was a significant difference in the species assemblages in streams affected by mining compared with streams with no mining run-off (Figure 2). The analysis was also extended to include water quality variables and this showed that streams with mining runoff were associated with increasing electrical conductivity, a measure of salinity.
We were able to not only provide an effective visual display of complex information, but also to determine if, and how, mining was impacting on the stream ecosystem.
October 2017