
Simulation and Optimisation
Complex real-life structures and systems can often be represented in a mathematical or statistical way. They can be conceptual models to better understand or simplify a process, or detailed data driven mathematical models to provide a theoretical understanding of relationships in a quantifiable way. Importantly, they need to be built so that the main characteristics are captured while simplifying the superfluous.
Developing a suitable model is the key. Once the model has been developed, simulations of the real-life system can be built in an artificial environment enabling a wide range of scenarios to be tested by changing the influential factors and observing the outputs under various conditions. Some simulations are deterministic, while some involve random aspects. Data Analysis Australia can then use the models for:
Understanding the inter-relationships of components in the system;
Sensitivity analysis to determine factors that most influence outputs;
Predicting the long-term behaviour of the system;
Predicting how the system responds when changes are made to the factors influencing it; and
- Optimising the system without the risks of upsetting the real operations.
Models are usually a trade-off between getting the detail right and maintaining sufficient simplicity to permit analysis. A combination of experience and experiment is often required. Mathematical theory is usually necessary for making judgements as to what is important. The experience of Data Analysis Australia in statistical data is often critical in building models. Some optimisations require simulation while others use more formal methods, such as linear and integer programming, to find the optimal solutions without the need for simulation.
Data Analysis Australia's newsletter article titled Shoemakers' Lasts and Model Ships describes our approach to modelling in more detail.
Experimental Design and the Football Draw
How do you optimally design experiments?
Have you ever wondered about how the AFL football draw, or indeed any competitive sporting draw, is selected? Clearly (if you can remain unbiased!) it is desirable to give every team an equal opportunity to finish on top of the ladder, based on merit rather than luck. Ideally each team would play every other team the same number of times and under the same conditions. However, this is not always possible in practice. Constraints such as the number of available playing days, limiting each team to not more than one game each weekend, and balancing the number of home and away or evening and afternoon games all need to be taken into account.
Excel Tool Design
How can you interact with simulations in Excel?
To many of our clients, Data Analysis Australia is well known for our ability to use complicated and sophisticated statistical and mathematical methods to analyse and understand our clients' data. Importantly, a key characteristic of Data Analysis Australia is our ability to translate our findings into a form that is designed specifically for our clients' needs. This could be anything from a highly technical report to a report written in everyday language, avoiding statistical jargon, but always explaining the relevant outcomes in context of our clients' business.
Related Case Studies
Microsimulation
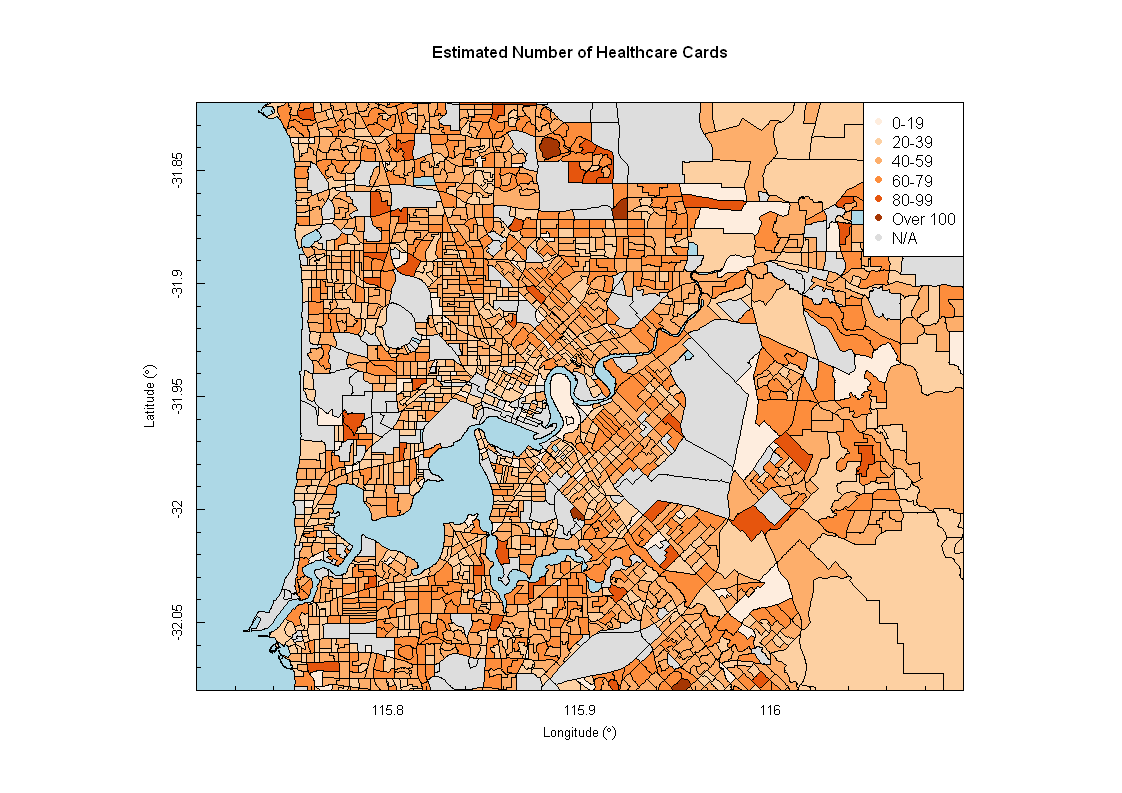
The Problem: How do we estimate the number of households with at least one healthcare card for each Australian Bureau of Statistics (ABS) Census collection district? For this analysis the term “healthcare card” refers to, all Veterans’ Affairs cards, the Commonwealth Seniors Healthcare card and the Healthcare card.
The Data Analysis Australia Approach: To use microsimulation (or small area estimation) to estimate households with at least one healthcare card using information available from the ABS 2006 Census and from the Household Income and Labour Dynamics Australia (HILDA) survey.
The Result: An estimate of the number of households with at least one healthcare card for each collection district in metropolitan Perth. These estimates provided added information that could assist with the determination of possible rebates for this group of households.
Simulation of Coal-Barging on a River
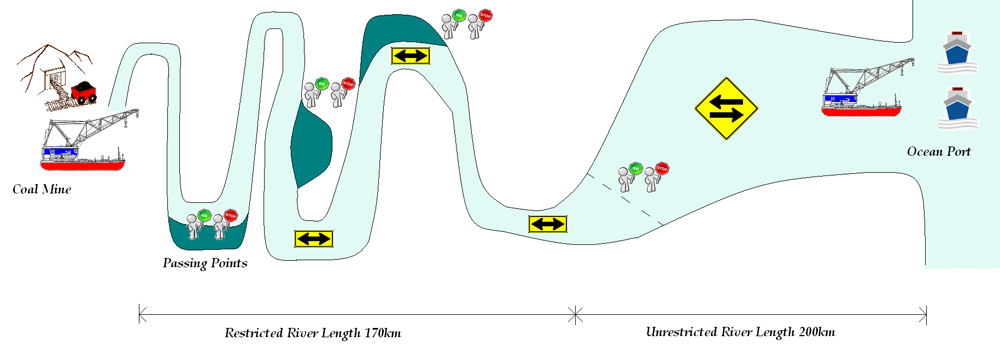
The Problem: How many tonnes of coal per annum can be transported along a river of variable navigability?
The Data Analysis Australia Approach: To develop a model to simulate barges carrying coal along a river taking into consideration sensitivities to certain elements such as navigability of the river, number of barge passing-points, ship arrival rates and reliability, and the number of barges running.
The Result: The simulation results aided the mining company in deciding that it would not be feasible to use barges to transport the amount of coal required from barge loading terminal to transhipment location.
Statistical Data Science
Analyse, visualise, and model data using the latest statistical and data science techniques
Surveys
Develop, carry out and analyse surveys to understand perception and find business insights
Forecasting and Prediction
Discover trends and predict the future with data
Spatial Analysis and Mapping
Learn how data is spatially correlated to inform strategy
Business and Risk Analysis
Understand how risk and uncertainty can be minimised in business decisions
Big Data and Machine Learning
Uncover trends and relationships to gain valuable insights from big data
Simulation and Optimisation
Determine the optimal way to operate in the future
Mining Analytics
Improve processes and uncover new insights
Interactive Dashboards
Make informed decisions from real-time data with intuitive visuals and information