
Statistical Data Science
Data can be confusing since it rarely records anything without some form of ambiguity, uncertainty or "error". Statistics is the theory and practice of most effectively extracting the real information from such data. It not only extracts this information, but does so with a clear statement on how precise any inferences can be.
The statistical methods that revolutionised science and industry in the twentieth century are continually being developed, especially in computation and large data sets. Data Analysis Australia brings together these methods to solve clients' problems. Our depth of statistical knowledge and our mathematical expertise means that we can apply the right set of tools for every problem either familiar or unique.
Data Analysis Australia statisticians employ a range of exploratory and analytical statistical techniques including:
Experimental design, ensuring information is collected as efficiently as possible;
Regression modelling, using classical linear models as well as modern extensions such as generalised additive models and structured equation models;
Multivariate methods such as factor analysis, conjoint analysis and perceptual mapping;
Cluster analysis and multi-dimensional scaling to understand complex datasets with many variables; and
Time series and longitudinal methods that can handle data with difficult correlations over time.
Weather Statistics
Are averages useful?
On 1st December 2010, the ABC reported that, according to Bureau of Meteorology (BOM), Australia had had a bumper spring for rainfall, 160mm on average across the land - about 100mm more than last year. On average that is a lot of extra rainfall and it would suggest that there has been sufficient rainfall in all regions of the country. However, is providing an average for the whole of Australia at all meaningful and, if not, why state it? For instance, if you live in the South West of Western Australia it is not at all comforting to know that on average there has been sufficient rainfall when this region has had an extreme dry period. In fact, according to BOM the South West has experienced its "warmest spring on record and its driest year on record". So, providing an average really fails to hammer home the issue of the variability across Australia, from state to state or even between the north and the south of Western Australia.
Models
All models are wrong, but some models are useful
Modelling is a long-standing method used to understand processes and phenomena. Astronomers created intricate mechanical models of the solar system, called orreries, to better understand how the planets moved relative to each other. For centuries boat builders used carefully made scale models to get the right "lines" for a hull and to test how they would behave in the water. Architects still construct scale models of major buildings to show what they will look like.
Related Case Studies
Understanding Environmental Impacts
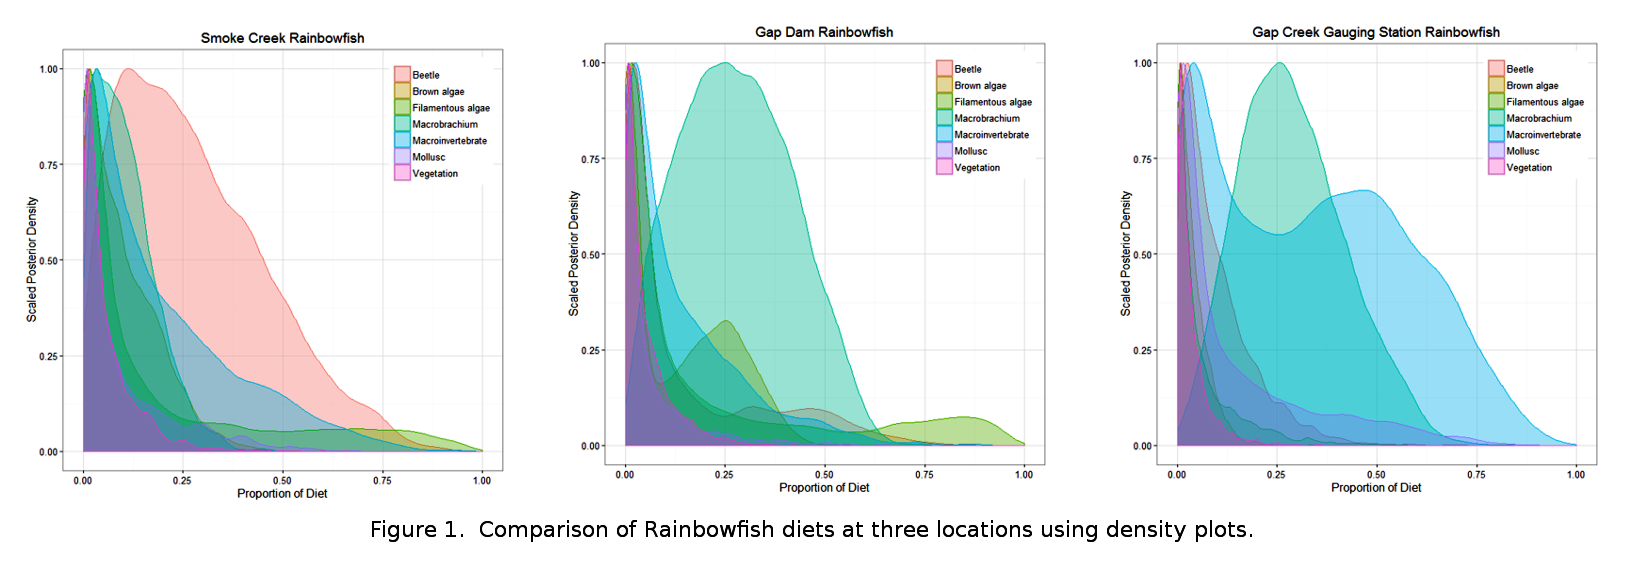
The Problem: Is diamond mining in the headwaters of Smoke and Limestone creeks in the Lake Argyle catchment having an impact on aquatic fauna biodiversity in the downstream environment?
The Data Analysis Australia Approach: Compared fish diets between streams using stable isotope mixing models and used multivariate analyses to eliminate non-important variables and to combine data on species, environmental and mining activity.
The Result: Fish diets were compared using attractive, easily interpreted density plots. By using multivariate analyses, the client was able to visualise the effects of diamond mining on freshwater macroinvertebrates and also to identify which water quality factors might be driving those impacts.
Evaluating the Perth Solar City Program
The Problem: Data Analysis Australia was contracted by Western Power to determine the effect of several interventions aimed at reducing households' energy consumption. Electricity consumption data was provided for approximately 30,000 households over several years, with a mix of detailed half-hourly readings from Smart Meters and two monthly billing-period consumptions.
The Data Analysis Australia Approach: To derive a sophisticated statistical model describing the patterns of electricity usage for each household before and after the intervention period and apply this to participant and non-participant (control) data collectively, providing an analysis equivalent to a Before-After Control-Intervention (BACI) analysis.
The Result: Most interventions had a statistically significant reduction in household energy consumption with the lowest consumption from households with energy saving systems installed (solar photovoltaic and solar hot water) followed by households with behavioural change interventions.
Statistical Data Science
Analyse, visualise, and model data using the latest statistical and data science techniques
Surveys
Develop, carry out and analyse surveys to understand perception and find business insights
Forecasting and Prediction
Discover trends and predict the future with data
Spatial Analysis and Mapping
Learn how data is spatially correlated to inform strategy
Business and Risk Analysis
Understand how risk and uncertainty can be minimised in business decisions
Big Data and Machine Learning
Uncover trends and relationships to gain valuable insights from big data
Simulation and Optimisation
Determine the optimal way to operate in the future
Mining Analytics
Improve processes and uncover new insights
Interactive Dashboards
Make informed decisions from real-time data with intuitive visuals and information